- Extruded or Pelletized Activated Carbon
- Granular Activated Carbons (GAC)
- Powdered Activated Carbons (PAC)
Activated Carbon Market size was valued at USD 5.1 billion in 2022 and is expected to reach USD 13.1 billion by 2029, at a CAGR of 16.20% from 2023-2029. Some of the key factors fostering the market growth include increasing demand for water treatment, conformance to stringent environmental regulations in water treatment applications, research, and new product development, pollution control activities leading to the demand for activated carbon, and technological advancements in manufacturing of activated carbon. However, the lack of raw materials supply, the presence of substitutes, and weak economic conditions are hampering the market growth. This report studies market dynamics elaborately to identify the current trends & drivers, future opportunities, and possible challenges to the key stakeholders operating in the market. In addition, This report includes human demographics; regulatory scenario, and competition analysis with a vividly illustrated competition dashboard to assess the market competition. Moreover, PBI analyzed the global market to better equip clients with possible investment opportunities across the regions (regional Investment Hot-Spots) and market unmet needs (Product opportunities).
Activated Carbon Market Summary
Study Period
2024-2030
Base Year
2023
CAGR
16.2%
Largest Market
Asia Pacific
Fastest Growing Market
North-America
Activated Carbon Market Dynamics
Activated carbon is a prevailing adsorbent used frequently throughout water purification efforts to remove contaminants and unwanted components. Activated carbon can be used in an extensive range of water treatment applications, it is an acute tool used through municipal and industrial water treatment facilities to treat drinking water, wastewater, and municipal water for process use. Activated carbon endures remaining one of the most preferred water treatment techniques because of its extraordinary array of applications and functions. It offer one of the most effective means of removing key contaminants such as THM and DBP as well as removing organic constituents and residual disinfectants in water supplies. This not only increases taste and minimizes health hazards but protects other water treatment units such as reverse osmosis membranes and ion exchange resins from possible damage due to oxidation or organic fouling.
Key Features of the Reports
- Global activated carbon market expanding at significant CAGR over 2023 to 2029 due to increasing demand in water treatment
- Based on product type, extruded or pelletized activated carbon segment accounted for larger market revenue share in 2022 and projected gain market revenue share over the forecast period
- Players focusing on innovation of newer products and collaboration strategies to retain market position in global Activated Carbon market

Activated Carbon Market Segmentation
By Product Type
By Application
- Gas Purification
- Medicine
- Metal Extraction
- Water Purification
- Other Applications
By End User
- Automotive
- Food and Beverage
- Healthcare
- Industrial
- Water Treatment
- Other End-user Industries
Frequently Asked Questions
The major key players operating in the activated carbon market are: The Calgon Carbon Corporation (U.S), Cabot Corporation (U.S), DESOTEC Activated Carbon (Belgium), Donau Carbon GmbH (Germany), Haycarb Plc. (Sri Lanka), Kuraray Chemical Co. Ltd ( Japan), KUREHA CORPORATION (Japan), Lenntech BV (the Netherlands), Osaka Gas Co. Ltd (Japan), Oxbow Activated Carbon LLC (U.S), Prominent Systems, Inc. (US), Silcarbon Akilotonivkohle GmbH (Germany), Jacobi (Sweden)
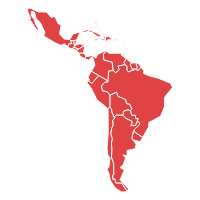
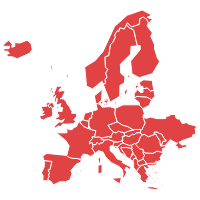
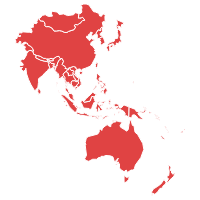
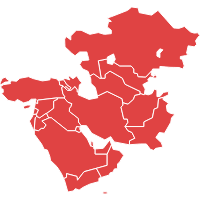
The report covers the five regions and 15+ countries market data: North America (United States, Canada), Europe (Germany, France, Italy, Spain, and United Kingdom (UK), Asia Pacific (China, India, Japan, Australia & New Zealand), Latin America (Brazil, Mexico, Argentina) and Middle East and Africa (Saudi Arabia, United Arab Emirates, South Africa).
In our report, we provide 12-15 market players’ information into the report. However, based on the client’s request we will provide additional country and regional market players information as well.
| 1. Executive Summary |
| 2. Global Activated Carbon Market Introduction |
| 2.1.Global Activated Carbon Market - Taxonomy |
| 2.2.Global Activated Carbon Market - Definitions |
| 2.2.1.Product Type |
| 2.2.2.Application |
| 2.2.3.End User |
| 2.2.4.Region |
| 3. Global Activated Carbon Market Dynamics |
| 3.1. Drivers |
| 3.2. Restraints |
| 3.3. Opportunities/Unmet Needs of the Market |
| 3.4. Trends |
| 3.5. Product Landscape |
| 3.6. New Product Launches |
| 3.7. Impact of COVID 19 on Market |
| 4. Global Activated Carbon Market Analysis, 2018-2022 and Forecast 2023-2029 |
| 4.1. Market Analysis, 2018-2022 and Forecast, 2023-2029, (Sales Value USD Million) |
| 4.2. Year-Over-Year (Y-o-Y) Growth Analysis (%) |
| 4.3. Market Opportunity Analysis |
| 5. Global Activated Carbon Market By Product Type, 2018-2022 and Forecast 2023-2029 (Sales Value USD Million) |
| 5.1. Extruded or Pelletized Activated Carbon |
| 5.1.1. Market Analysis, 2018-2022 and Forecast, 2023-2029, (Sales Value USD Million) |
| 5.1.2. Year-Over-Year (Y-o-Y) Growth Analysis (%) and Market Share Analysis (%) |
| 5.1.3. Market Opportunity Analysis |
| 5.2. Granular Activated Carbons (GAC) |
| 5.2.1. Market Analysis, 2018-2022 and Forecast, 2023-2029, (Sales Value USD Million) |
| 5.2.2. Year-Over-Year (Y-o-Y) Growth Analysis (%) and Market Share Analysis (%) |
| 5.2.3. Market Opportunity Analysis |
| 5.3. Powdered Activated Carbons (PAC) |
| 5.3.1. Market Analysis, 2018-2022 and Forecast, 2023-2029, (Sales Value USD Million) |
| 5.3.2. Year-Over-Year (Y-o-Y) Growth Analysis (%) and Market Share Analysis (%) |
| 5.3.3. Market Opportunity Analysis |
| 6. Global Activated Carbon Market By Application , 2018-2022 and Forecast 2023-2029 (Sales Value USD Million) |
| 6.1. Gas Purification |
| 6.1.1. Market Analysis, 2018-2022 and Forecast, 2023-2029, (Sales Value USD Million) |
| 6.1.2. Year-Over-Year (Y-o-Y) Growth Analysis (%) and Market Share Analysis (%) |
| 6.1.3. Market Opportunity Analysis |
| 6.2. Medicine |
| 6.2.1. Market Analysis, 2018-2022 and Forecast, 2023-2029, (Sales Value USD Million) |
| 6.2.2. Year-Over-Year (Y-o-Y) Growth Analysis (%) and Market Share Analysis (%) |
| 6.2.3. Market Opportunity Analysis |
| 6.3. Metal Extraction |
| 6.3.1. Market Analysis, 2018-2022 and Forecast, 2023-2029, (Sales Value USD Million) |
| 6.3.2. Year-Over-Year (Y-o-Y) Growth Analysis (%) and Market Share Analysis (%) |
| 6.3.3. Market Opportunity Analysis |
| 6.4. Water Purification |
| 6.4.1. Market Analysis, 2018-2022 and Forecast, 2023-2029, (Sales Value USD Million) |
| 6.4.2. Year-Over-Year (Y-o-Y) Growth Analysis (%) and Market Share Analysis (%) |
| 6.4.3. Market Opportunity Analysis |
| 6.5. Other Applications |
| 6.5.1. Market Analysis, 2018-2022 and Forecast, 2023-2029, (Sales Value USD Million) |
| 6.5.2. Year-Over-Year (Y-o-Y) Growth Analysis (%) and Market Share Analysis (%) |
| 6.5.3. Market Opportunity Analysis |
| 7. Global Activated Carbon Market By End User, 2018-2022 and Forecast 2023-2029 (Sales Value USD Million) |
| 7.1. Automotive |
| 7.1.1. Market Analysis, 2018-2022 and Forecast, 2023-2029, (Sales Value USD Million) |
| 7.1.2. Year-Over-Year (Y-o-Y) Growth Analysis (%) and Market Share Analysis (%) |
| 7.1.3. Market Opportunity Analysis |
| 7.2. Food and Beverage |
| 7.2.1. Market Analysis, 2018-2022 and Forecast, 2023-2029, (Sales Value USD Million) |
| 7.2.2. Year-Over-Year (Y-o-Y) Growth Analysis (%) and Market Share Analysis (%) |
| 7.2.3. Market Opportunity Analysis |
| 7.3. Healthcare |
| 7.3.1. Market Analysis, 2018-2022 and Forecast, 2023-2029, (Sales Value USD Million) |
| 7.3.2. Year-Over-Year (Y-o-Y) Growth Analysis (%) and Market Share Analysis (%) |
| 7.3.3. Market Opportunity Analysis |
| 7.4. Industrial |
| 7.4.1. Market Analysis, 2018-2022 and Forecast, 2023-2029, (Sales Value USD Million) |
| 7.4.2. Year-Over-Year (Y-o-Y) Growth Analysis (%) and Market Share Analysis (%) |
| 7.4.3. Market Opportunity Analysis |
| 7.5. Water Treatment |
| 7.5.1. Market Analysis, 2018-2022 and Forecast, 2023-2029, (Sales Value USD Million) |
| 7.5.2. Year-Over-Year (Y-o-Y) Growth Analysis (%) and Market Share Analysis (%) |
| 7.5.3. Market Opportunity Analysis |
| 7.6. Other End-user Industries |
| 7.6.1. Market Analysis, 2018-2022 and Forecast, 2023-2029, (Sales Value USD Million) |
| 7.6.2. Year-Over-Year (Y-o-Y) Growth Analysis (%) and Market Share Analysis (%) |
| 7.6.3. Market Opportunity Analysis |
| 8. Global Activated Carbon Market By Region, 2018-2022 and Forecast 2023-2029 (Sales Value USD Million) |
| 8.1. North America |
| 8.1.1. Market Analysis, 2018-2022 and Forecast, 2023-2029, (Sales Value USD Million) |
| 8.1.2. Year-Over-Year (Y-o-Y) Growth Analysis (%) and Market Share Analysis (%) |
| 8.1.3. Market Opportunity Analysis |
| 8.2. Europe |
| 8.2.1. Market Analysis, 2018-2022 and Forecast, 2023-2029, (Sales Value USD Million) |
| 8.2.2. Year-Over-Year (Y-o-Y) Growth Analysis (%) and Market Share Analysis (%) |
| 8.2.3. Market Opportunity Analysis |
| 8.3. Asia Pacific (APAC) |
| 8.3.1. Market Analysis, 2018-2022 and Forecast, 2023-2029, (Sales Value USD Million) |
| 8.3.2. Year-Over-Year (Y-o-Y) Growth Analysis (%) and Market Share Analysis (%) |
| 8.3.3. Market Opportunity Analysis |
| 8.4. Middle East and Africa (MEA) |
| 8.4.1. Market Analysis, 2018-2022 and Forecast, 2023-2029, (Sales Value USD Million) |
| 8.4.2. Year-Over-Year (Y-o-Y) Growth Analysis (%) and Market Share Analysis (%) |
| 8.4.3. Market Opportunity Analysis |
| 8.5. Latin America |
| 8.5.1. Market Analysis, 2018-2022 and Forecast, 2023-2029, (Sales Value USD Million) |
| 8.5.2. Year-Over-Year (Y-o-Y) Growth Analysis (%) and Market Share Analysis (%) |
| 8.5.3. Market Opportunity Analysis |
| 9. North America Activated Carbon Market ,2018-2022 and Forecast 2023-2029 (Sales Value USD Million) |
| 9.1. Product Type Analysis 2018-2022 and Forecast 2023-2029 by Sales Value USD Million, Y-o-Y Growth (%), and Market Share (%) |
| 9.1.1.Extruded or Pelletized Activated Carbon |
| 9.1.2.Granular Activated Carbons (GAC) |
| 9.1.3.Powdered Activated Carbons (PAC) |
| 9.2. Application Analysis 2018-2022 and Forecast 2023-2029 by Sales Value USD Million, Y-o-Y Growth (%), and Market Share (%) |
| 9.2.1.Gas Purification |
| 9.2.2.Medicine |
| 9.2.3.Metal Extraction |
| 9.2.4.Water Purification |
| 9.2.5.Other Applications |
| 9.3. End User Analysis 2018-2022 and Forecast 2023-2029 by Sales Value USD Million, Y-o-Y Growth (%), and Market Share (%) |
| 9.3.1.Automotive |
| 9.3.2.Food and Beverage |
| 9.3.3.Healthcare |
| 9.3.4.Industrial |
| 9.3.5.Water Treatment |
| 9.3.6.Other End-user Industries |
| 9.4. Country Analysis 2018-2022 and Forecast 2023-2029 by Sales Value USD Million, Y-o-Y Growth (%), and Market Share (%) |
| 9.4.1.United States of America (USA) |
| 9.4.2.Canada |
| 10. Europe Activated Carbon Market ,2018-2022 and Forecast 2023-2029 (Sales Value USD Million) |
| 10.1. Product Type Analysis and Forecast by Sales Value USD Million, Y-o-Y Growth (%), and Market Share (%) |
| 10.1.1.Extruded or Pelletized Activated Carbon |
| 10.1.2.Granular Activated Carbons (GAC) |
| 10.1.3.Powdered Activated Carbons (PAC) |
| 10.2. Application Analysis 2018-2022 and Forecast 2023-2029 by Sales Value USD Million, Y-o-Y Growth (%), and Market Share (%) |
| 10.2.1.Gas Purification |
| 10.2.2.Medicine |
| 10.2.3.Metal Extraction |
| 10.2.4.Water Purification |
| 10.2.5.Other Applications |
| 10.3. End User Analysis 2018-2022 and Forecast 2023-2029 by Sales Value USD Million, Y-o-Y Growth (%), and Market Share (%) |
| 10.3.1.Automotive |
| 10.3.2.Food and Beverage |
| 10.3.3.Healthcare |
| 10.3.4.Industrial |
| 10.3.5.Water Treatment |
| 10.3.6.Other End-user Industries |
| 10.4. Country Analysis 2018-2022 and Forecast 2023-2029 by Sales Value USD Million, Y-o-Y Growth (%), and Market Share (%) |
| 10.4.1.Germany |
| 10.4.2.France |
| 10.4.3.Italy |
| 10.4.4.United Kingdom (UK) |
| 10.4.5.Spain |
| 10.4.6.Rest of EU |
| 10.4.7. |
| 11. Asia Pacific (APAC) Activated Carbon Market ,2018-2022 and Forecast 2023-2029 (Sales Value USD Million) |
| 11.1. Product Type Analysis and Forecast by Sales Value USD Million, Y-o-Y Growth (%), and Market Share (%) |
| 11.1.1.Extruded or Pelletized Activated Carbon |
| 11.1.2.Granular Activated Carbons (GAC) |
| 11.1.3.Powdered Activated Carbons (PAC) |
| 11.2. Application Analysis 2018-2022 and Forecast 2023-2029 by Sales Value USD Million, Y-o-Y Growth (%), and Market Share (%) |
| 11.2.1.Gas Purification |
| 11.2.2.Medicine |
| 11.2.3.Metal Extraction |
| 11.2.4.Water Purification |
| 11.2.5.Other Applications |
| 11.3. End User Analysis 2018-2022 and Forecast 2023-2029 by Sales Value USD Million, Y-o-Y Growth (%), and Market Share (%) |
| 11.3.1.Automotive |
| 11.3.2.Food and Beverage |
| 11.3.3.Healthcare |
| 11.3.4.Industrial |
| 11.3.5.Water Treatment |
| 11.3.6.Other End-user Industries |
| 11.4. Country Analysis 2018-2022 and Forecast 2023-2029 by Sales Value USD Million, Y-o-Y Growth (%), and Market Share (%) |
| 11.4.1.China |
| 11.4.2.India |
| 11.4.3.Australia and New Zealand (ANZ) |
| 11.4.4.Japan |
| 11.4.5.Rest of APAC |
| 12. Middle East and Africa (MEA) Activated Carbon Market ,2018-2022 and Forecast 2023-2029 (Sales Value USD Million) |
| 12.1. Product Type Analysis and Forecast by Sales Value USD Million, Y-o-Y Growth (%), and Market Share (%) |
| 12.1.1.Extruded or Pelletized Activated Carbon |
| 12.1.2.Granular Activated Carbons (GAC) |
| 12.1.3.Powdered Activated Carbons (PAC) |
| 12.2. Application Analysis 2018-2022 and Forecast 2023-2029 by Sales Value USD Million, Y-o-Y Growth (%), and Market Share (%) |
| 12.2.1.Gas Purification |
| 12.2.2.Medicine |
| 12.2.3.Metal Extraction |
| 12.2.4.Water Purification |
| 12.2.5.Other Applications |
| 12.3. End User Analysis 2018-2022 and Forecast 2023-2029 by Sales Value USD Million, Y-o-Y Growth (%), and Market Share (%) |
| 12.3.1.Automotive |
| 12.3.2.Food and Beverage |
| 12.3.3.Healthcare |
| 12.3.4.Industrial |
| 12.3.5.Water Treatment |
| 12.3.6.Other End-user Industries |
| 12.4. Country Analysis 2018-2022 and Forecast 2023-2029 by Sales Value USD Million, Y-o-Y Growth (%), and Market Share (%) |
| 12.4.1.GCC Countries |
| 12.4.2.South Africa |
| 12.4.3.Rest of MEA |
| 13. Latin America Activated Carbon Market ,2018-2022 and Forecast 2023-2029 (Sales Value USD Million) |
| 13.1. Product Type Analysis and Forecast by Sales Value USD Million, Y-o-Y Growth (%), and Market Share (%) |
| 13.1.1.Extruded or Pelletized Activated Carbon |
| 13.1.2.Granular Activated Carbons (GAC) |
| 13.1.3.Powdered Activated Carbons (PAC) |
| 13.2. Application Analysis 2018-2022 and Forecast 2023-2029 by Sales Value USD Million, Y-o-Y Growth (%), and Market Share (%) |
| 13.2.1.Gas Purification |
| 13.2.2.Medicine |
| 13.2.3.Metal Extraction |
| 13.2.4.Water Purification |
| 13.2.5.Other Applications |
| 13.3. End User Analysis 2018-2022 and Forecast 2023-2029 by Sales Value USD Million, Y-o-Y Growth (%), and Market Share (%) |
| 13.3.1.Automotive |
| 13.3.2.Food and Beverage |
| 13.3.3.Healthcare |
| 13.3.4.Industrial |
| 13.3.5.Water Treatment |
| 13.3.6.Other End-user Industries |
| 13.4. Country Analysis 2018-2022 and Forecast 2023-2029 by Sales Value USD Million, Y-o-Y Growth (%), and Market Share (%) |
| 13.4.1.Brazil |
| 13.4.2.Mexico |
| 13.4.3.Rest of LA |
| 14. Competition Landscape |
| 14.1. Market Player Profiles (Introduction, Brand/Product Sales, Financial Analysis, Product Offerings, Key Developments, Collaborations, M & A, Strategies, and SWOT Analysis) |
| 14.2.1.The Calgon Carbon Corporation (U.S) |
| 14.2.2.Cabot Corporation (U.S) |
| 14.2.3.DESOTEC Activated Carbon (Belgium) |
| 14.2.4.Donau Carbon GmbH (Germany) |
| 14.2.5.Haycarb Plc. (Sri Lanka) |
| 14.2.6.Kuraray Chemical Co. Ltd ( Japan) |
| 14.2.7.KUREHA CORPORATION (Japan) |
| 14.2.8.Lenntech BV (the Netherlands) |
| 14.2.9.Osaka Gas Co. Ltd (Japan) |
| 14.2.10.Oxbow Activated Carbon LLC (U.S) |
| 14.2.11.Prominent Systems, Inc. (US) |
| 14.2.12.Silcarbon Akilotonivkohle GmbH (Germany) |
| 14.2.13.Jacobi (Sweden) |
| 15. Research Methodology |
| 16. Appendix and Abbreviations |
- The Calgon Carbon Corporation (U.S)
- Cabot Corporation (U.S)
- DESOTEC Activated Carbon (Belgium)
- Donau Carbon GmbH (Germany)
- Haycarb Plc. (Sri Lanka)
- Kuraray Chemical Co. Ltd ( Japan)
- KUREHA CORPORATION (Japan)
- Lenntech BV (the Netherlands)
- Osaka Gas Co. Ltd (Japan)
- Oxbow Activated Carbon LLC (U.S)
- Prominent Systems, Inc. (US)
- Silcarbon Akilotonivkohle GmbH (Germany)
- Jacobi (Sweden)
