- Vitamins
- Carbohydrates
- Minerals
- Fibers
- Fatty acids
- Amino Acids
- Proteins
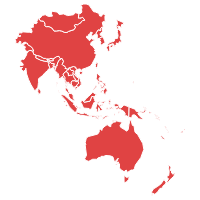
Asia Pacific Animal Nutrition Market size was valued at USD 145.4 billion in 2022 and is expected to reach USD 197.8 billion by 2029 growing at a CAGR of 4.5% during the forecast period 2023 to 2029. Burgeoning the population in the region is expected to increase the demand for meat and other products. Adoption of the pets, rise in care and concern of the animals health will play a vital role in animal nutrition market. On the other side, rise in the cost of feed, limited awareness is expected to hinder the growth of animal nutrition market.
Asia Pacific Animal Nutrition Market Dynamics
The trend towards the protein lean animal diet, rise in consumption of meat, poultry and dairy products around the world is expected to stipulate the growth of animal nutrition market.
Key Features of the Reports
- The asia pacific animal nutrition market report provides granular level information about the market size, regional market share, historic market (2018 to 2022) and forecast (2023 to 2029)
- The report covers in-detail insights about the competitor’s overview, company share analysis, key market developments, and their key strategies
- The report outlines drivers, restraints, unmet needs, and trends that are currently affecting the market
- The report tracks recent innovations, key developments and startup’s details that are actively working in the market
- The report provides plethora of information about market entry strategies, regulatory framework and reimbursement scenario
- The report analyses the impact of socio-political environment through PESTLE Analysis and competition through Porter’s Five Force Analysis in addition to recent technology advancements and innovations in the market

Asia Pacific Animal Nutrition Market Segmentation
By Type
By Animal type
- Poultry
- Swine
- Ruminant
- Canine
- Equine
- Aquatic
Frequently Asked Questions
2023 is the base year and 2029 is the forecast year.
The report covers the asia pacific animal nutrition market data: China, India, Japan, Australia & New Zealand
The asia pacific animal nutrition market key players are Nutreco N.V., Cargill, Inc, Koninklijke DSM N.V., Archer Daniels Midland Company, BASF SE, DSM Nutritional Products Ltd
| 1.Executive Summary |
| 2. Asia Pacific Animal Nutrition Market Introduction |
| 2.1. Asia Pacific Animal Nutrition Market - Taxonomy |
| 2.2. Asia Pacific Animal Nutrition Market - Definitions |
| 2.2.1.Type |
| 2.2.2.Animal Type |
| 2.2.3.Country |
| 3. Asia Pacific Animal Nutrition Market Dynamics |
| 3.1. Drivers |
| 3.2. Restraints |
| 3.3. Opportunities/Unmet Needs of the Market |
| 3.4. Trends |
| 3.5. Product Landscape |
| 3.6. New Product Launches |
| 3.7. Impact of COVID 19 on Market |
| 4. Asia Pacific Animal Nutrition Market Analysis, 2018-2022 and Forecast 2023-2029 |
| 4.1. Market Analysis, 2018-2022 and Forecast, 2023-2029, (Sales Value USD Million) |
| 4.2. Year-Over-Year (Y-o-Y) Growth Analysis (%) |
| 4.3. Market Opportunity Analysis |
| 5. Asia Pacific Animal Nutrition Market By Type, 2018-2022 and Forecast 2023-2029 (Sales Value USD Million) |
| 5.1. Vitamins |
| 5.1.1. Market Analysis, 2018-2022 and Forecast, 2023-2029, (Sales Value USD Million) |
| 5.1.2. Year-Over-Year (Y-o-Y) Growth Analysis (%) and Market Share Analysis (%) |
| 5.1.3. Market Opportunity Analysis |
| 5.2. Carbohydrates |
| 5.2.1. Market Analysis, 2018-2022 and Forecast, 2023-2029, (Sales Value USD Million) |
| 5.2.2. Year-Over-Year (Y-o-Y) Growth Analysis (%) and Market Share Analysis (%) |
| 5.2.3. Market Opportunity Analysis |
| 5.3. Minerals |
| 5.3.1. Market Analysis, 2018-2022 and Forecast, 2023-2029, (Sales Value USD Million) |
| 5.3.2. Year-Over-Year (Y-o-Y) Growth Analysis (%) and Market Share Analysis (%) |
| 5.3.3. Market Opportunity Analysis |
| 5.4. Fibers |
| 5.4.1. Market Analysis, 2018-2022 and Forecast, 2023-2029, (Sales Value USD Million) |
| 5.4.2. Year-Over-Year (Y-o-Y) Growth Analysis (%) and Market Share Analysis (%) |
| 5.4.3. Market Opportunity Analysis |
| 5.5. Fatty acids |
| 5.5.1. Market Analysis, 2018-2022 and Forecast, 2023-2029, (Sales Value USD Million) |
| 5.5.2. Year-Over-Year (Y-o-Y) Growth Analysis (%) and Market Share Analysis (%) |
| 5.5.3. Market Opportunity Analysis |
| 5.6. Amino Acids |
| 5.6.1. Market Analysis, 2018-2022 and Forecast, 2023-2029, (Sales Value USD Million) |
| 5.6.2. Year-Over-Year (Y-o-Y) Growth Analysis (%) and Market Share Analysis (%) |
| 5.6.3. Market Opportunity Analysis |
| 5.7. Proteins |
| 5.7.1. Market Analysis, 2018-2022 and Forecast, 2023-2029, (Sales Value USD Million) |
| 5.7.2. Year-Over-Year (Y-o-Y) Growth Analysis (%) and Market Share Analysis (%) |
| 5.7.3. Market Opportunity Analysis |
| 6. Asia Pacific Animal Nutrition Market By Animal Type, 2018-2022 and Forecast 2023-2029 (Sales Value USD Million) |
| 6.1. Poultry |
| 6.1.1. Market Analysis, 2018-2022 and Forecast, 2023-2029, (Sales Value USD Million) |
| 6.1.2. Year-Over-Year (Y-o-Y) Growth Analysis (%) and Market Share Analysis (%) |
| 6.1.3. Market Opportunity Analysis |
| 6.2. Swine |
| 6.2.1. Market Analysis, 2018-2022 and Forecast, 2023-2029, (Sales Value USD Million) |
| 6.2.2. Year-Over-Year (Y-o-Y) Growth Analysis (%) and Market Share Analysis (%) |
| 6.2.3. Market Opportunity Analysis |
| 6.3. Ruminant |
| 6.3.1. Market Analysis, 2018-2022 and Forecast, 2023-2029, (Sales Value USD Million) |
| 6.3.2. Year-Over-Year (Y-o-Y) Growth Analysis (%) and Market Share Analysis (%) |
| 6.3.3. Market Opportunity Analysis |
| 6.4. Canine |
| 6.4.1. Market Analysis, 2018-2022 and Forecast, 2023-2029, (Sales Value USD Million) |
| 6.4.2. Year-Over-Year (Y-o-Y) Growth Analysis (%) and Market Share Analysis (%) |
| 6.4.3. Market Opportunity Analysis |
| 6.5. Equine |
| 6.5.1. Market Analysis, 2018-2022 and Forecast, 2023-2029, (Sales Value USD Million) |
| 6.5.2. Year-Over-Year (Y-o-Y) Growth Analysis (%) and Market Share Analysis (%) |
| 6.5.3. Market Opportunity Analysis |
| 6.6. Aquatic |
| 6.6.1. Market Analysis, 2018-2022 and Forecast, 2023-2029, (Sales Value USD Million) |
| 6.6.2. Year-Over-Year (Y-o-Y) Growth Analysis (%) and Market Share Analysis (%) |
| 6.6.3. Market Opportunity Analysis |
| 7. Asia Pacific Animal Nutrition Market By Country, 2018-2022 and Forecast 2023-2029 (Sales Value USD Million) |
| 7.1. China |
| 7.1.1. Market Analysis, 2018-2022 and Forecast, 2023-2029, (Sales Value USD Million) |
| 7.1.2. Year-Over-Year (Y-o-Y) Growth Analysis (%) and Market Share Analysis (%) |
| 7.1.3. Market Opportunity Analysis |
| 7.2. India |
| 7.2.1. Market Analysis, 2018-2022 and Forecast, 2023-2029, (Sales Value USD Million) |
| 7.2.2. Year-Over-Year (Y-o-Y) Growth Analysis (%) and Market Share Analysis (%) |
| 7.2.3. Market Opportunity Analysis |
| 7.3. Australia and New Zealand (ANZ) |
| 7.3.1. Market Analysis, 2018-2022 and Forecast, 2023-2029, (Sales Value USD Million) |
| 7.3.2. Year-Over-Year (Y-o-Y) Growth Analysis (%) and Market Share Analysis (%) |
| 7.3.3. Market Opportunity Analysis |
| 7.4. Japan |
| 7.4.1. Market Analysis, 2018-2022 and Forecast, 2023-2029, (Sales Value USD Million) |
| 7.4.2. Year-Over-Year (Y-o-Y) Growth Analysis (%) and Market Share Analysis (%) |
| 7.4.3. Market Opportunity Analysis |
| 7.5. Rest of APAC |
| 7.5.1. Market Analysis, 2018-2022 and Forecast, 2023-2029, (Sales Value USD Million) |
| 7.5.2. Year-Over-Year (Y-o-Y) Growth Analysis (%) and Market Share Analysis (%) |
| 7.5.3. Market Opportunity Analysis |
| 8.China Animal Nutrition Market ,2018-2022 and Forecast 2023-2029 (Sales Value USD Million) |
| 8.1. Type Analysis 2018-2022 and Forecast 2023-2029 by Sales Value USD Million, Y-o-Y Growth (%), and Market Share (%) |
| 8.1.1.Vitamins |
| 8.1.2.Carbohydrates |
| 8.1.3.Minerals |
| 8.1.4.Fibers |
| 8.1.5.Fatty acids |
| 8.1.6.Amino Acids |
| 8.1.7.Proteins |
| 8.2. Animal Type Analysis 2018-2022 and Forecast 2023-2029 by Sales Value USD Million, Y-o-Y Growth (%), and Market Share (%) |
| 8.2.1.Poultry |
| 8.2.2.Swine |
| 8.2.3.Ruminant |
| 8.2.4.Canine |
| 8.2.5.Equine |
| 8.2.6.Aquatic |
| 9.India Animal Nutrition Market ,2018-2022 and Forecast 2023-2029 (Sales Value USD Million) |
| 9.1. Type Analysis and Forecast by Sales Value USD Million, Y-o-Y Growth (%), and Market Share (%) |
| 9.1.1.Vitamins |
| 9.1.2.Carbohydrates |
| 9.1.3.Minerals |
| 9.1.4.Fibers |
| 9.1.5.Fatty acids |
| 9.1.6.Amino Acids |
| 9.1.7.Proteins |
| 9.2. Animal Type Analysis 2018-2022 and Forecast 2023-2029 by Sales Value USD Million, Y-o-Y Growth (%), and Market Share (%) |
| 9.2.1.Poultry |
| 9.2.2.Swine |
| 9.2.3.Ruminant |
| 9.2.4.Canine |
| 9.2.5.Equine |
| 9.2.6.Aquatic |
| 10.Australia and New Zealand (ANZ) Animal Nutrition Market ,2018-2022 and Forecast 2023-2029 (Sales Value USD Million) |
| 10.1. Type Analysis and Forecast by Sales Value USD Million, Y-o-Y Growth (%), and Market Share (%) |
| 10.1.1.Vitamins |
| 10.1.2.Carbohydrates |
| 10.1.3.Minerals |
| 10.1.4.Fibers |
| 10.1.5.Fatty acids |
| 10.1.6.Amino Acids |
| 10.1.7.Proteins |
| 10.2. Animal Type Analysis 2018-2022 and Forecast 2023-2029 by Sales Value USD Million, Y-o-Y Growth (%), and Market Share (%) |
| 10.2.1.Poultry |
| 10.2.2.Swine |
| 10.2.3.Ruminant |
| 10.2.4.Canine |
| 10.2.5.Equine |
| 10.2.6.Aquatic |
| 11.Japan Animal Nutrition Market ,2018-2022 and Forecast 2023-2029 (Sales Value USD Million) |
| 11.1. Type Analysis and Forecast by Sales Value USD Million, Y-o-Y Growth (%), and Market Share (%) |
| 11.1.1.Vitamins |
| 11.1.2.Carbohydrates |
| 11.1.3.Minerals |
| 11.1.4.Fibers |
| 11.1.5.Fatty acids |
| 11.1.6.Amino Acids |
| 11.1.7.Proteins |
| 11.2. Animal Type Analysis 2018-2022 and Forecast 2023-2029 by Sales Value USD Million, Y-o-Y Growth (%), and Market Share (%) |
| 11.2.1.Poultry |
| 11.2.2.Swine |
| 11.2.3.Ruminant |
| 11.2.4.Canine |
| 11.2.5.Equine |
| 11.2.6.Aquatic |
| 12.Rest of APAC Animal Nutrition Market ,2018-2022 and Forecast 2023-2029 (Sales Value USD Million) |
| 12.1. Type Analysis and Forecast by Sales Value USD Million, Y-o-Y Growth (%), and Market Share (%) |
| 12.1.1.Vitamins |
| 12.1.2.Carbohydrates |
| 12.1.3.Minerals |
| 12.1.4.Fibers |
| 12.1.5.Fatty acids |
| 12.1.6.Amino Acids |
| 12.1.7.Proteins |
| 12.2. Animal Type Analysis 2018-2022 and Forecast 2023-2029 by Sales Value USD Million, Y-o-Y Growth (%), and Market Share (%) |
| 12.2.1.Poultry |
| 12.2.2.Swine |
| 12.2.3.Ruminant |
| 12.2.4.Canine |
| 12.2.5.Equine |
| 12.2.6.Aquatic |
| 13. Competition Landscape |
| 13.1. Market Player Profiles (Introduction, Brand/Product Sales, Financial Analysis, Product Offerings, Key Developments, Collaborations, M & A, Strategies, and SWOT Analysis) |
| 13.2.1.Nutreco N.V. |
| 13.2.2.Cargill, Inc. |
| 13.2.3.Koninklijke DSM N.V. |
| 13.2.4.Archer Daniels Midland Company |
| 13.2.5.BASF SE |
| 13.2.6.DSM Nutritional Products Ltd. |
| 14. Research Methodology |
| 15. Appendix and Abbreviations |
- Nutreco N.V.
- Cargill, Inc.
- Koninklijke DSM N.V.
- Archer Daniels Midland Company
- BASF SE
- DSM Nutritional Products Ltd.
