- Capnographs
- Micro-Stream Capnographs
- Side-Stream Capnographs
- Main Stream Capnographs
- Disposables
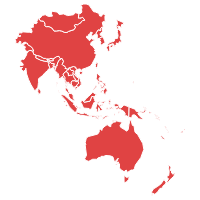
Asia Pacific Capnography Devices Market size was valued at USD 97.6 million in 2022 and is poised to grow at a CAAGR of 7.2% from 2023 to 2029. Capnography is the process of monitoring partial pressure or concentration of carbon dioxide in respiratory gases by using capnogram. It is majorly used as a monitoring tool during intensive care and anesthesia. Capnography helps to anesthesiologists to prevent the hypoxia and help to determine the situations that can lead to hypoxia and may cause irreversible brain damage. Due to these advantages, capnography is widely used in endoscopic suites, emergency rooms, x-ray rooms, and on-site emergency and trauma centers. In healthy individuals, difference between the arterial blood and expired CO2 partial pressure is very small however, in presence of lung disease, and some congenital heart disease the difference is increased and can exceed 1 kPa. However, alternative devices availability for capnography such as pulse oximeter, new clinical studies restraining the usage in non-intubated individuals, and issues associated with capnography usage are impedeing the growth of the market.
Asia Pacific Capnography Devices Market Dynamics
Increase in the prevalence of respiratory diseases such as COPD, pulmonary embolism, bronchospastic diseases and asthma, growing geriatric population, technological advances in capnography devices such as are anticipated to fuel the Asia Pacific capnography devices market. Moreover, wide range of applications of capnography such as hypoventilation, esophageal intubation, and endotracheal tube placement, rise in awareness about capnography devices among physicians, and adoption of newer technologies are expected to boost the market.
Key Features of the Reports
- The report provides granular level information about the market size, regional market share, historic market (2019-2023), and forecast (2024-2030)
- The report covers in-detail insights about the competitor's overview, company share analysis, key market developments, and their key strategies
- The report outlines drivers, restraints, unmet needs, and trends that are currently affecting the market
- The report tracks recent innovations, key developments, and start-up details that are actively working in the market
- The report provides a plethora of information about market entry strategies, regulatory framework, and reimbursement scenario

Asia Pacific Capnography Devices Market Segmentation
By Product Type
By Technology
- Hand-Held Monitors
- Stand-Alone Monitors
- Others
By Application
- Anesthesia
- Procedural Sedation
- Intensive Care
- Pain Management
- Emergency Medicine
- Others
By End User
- Hospitals
- Clinics
- Ambulatory Surgical Centers
Frequently Asked Questions
The asia pacific capnography devices market size was valued at USD 97.6 million in 2022
The report covers thecountries market data: Asia Pacific China, India, Japan, Australia & New Zealand
Masimo Corporation, Covidien plc, Nihon Kohden Corporatio, Smiths Medical, Inc., Welch Allyn Inc.
| 1.Executive Summary |
| 2.Asia Pacific Capnography Devices Market Introduction |
| 2.1.Asia Pacific Capnography Devices Market - Taxonomy |
| 2.2.Asia Pacific Capnography Devices Market - Definitions |
| 2.2.1.Product Type |
| 2.2.2.Technology |
| 2.2.3.Application |
| 2.2.4.End User |
| 2.2.5.Country |
| 3.Asia Pacific Capnography Devices Market Dynamics |
| 3.1. Drivers |
| 3.2. Restraints |
| 3.3. Opportunities/Unmet Needs of the Market |
| 3.4. Trends |
| 3.5. Product Landscape |
| 3.6. New Product Launches |
| 3.7. Impact of COVID 19 on Market |
| 4.Asia Pacific Capnography Devices Market Analysis, 2018 - 2022 and Forecast 2023 - 2029 |
| 4.1. Market Analysis, 2018 - 2022 and Forecast, 2023 - 2029, (Sales Value USD Million) |
| 4.2. Year-Over-Year (Y-o-Y) Growth Analysis (%) |
| 4.3. Market Opportunity Analysis |
| 5.Asia Pacific Capnography Devices Market By Product Type , 2018 - 2022 and Forecast 2023 - 2029 (Sales Value USD Million) |
| 5.1. Capnographs |
| 5.1.1. Market Analysis, 2018 - 2022 and Forecast, 2023 - 2029, (Sales Value USD Million) |
| 5.1.2. Year-Over-Year (Y-o-Y) Growth Analysis (%) and Market Share Analysis (%) |
| 5.1.3. Market Opportunity Analysis |
| 5.2. Disposables |
| 5.2.1. Market Analysis, 2018 - 2022 and Forecast, 2023 - 2029, (Sales Value USD Million) |
| 5.2.2. Year-Over-Year (Y-o-Y) Growth Analysis (%) and Market Share Analysis (%) |
| 5.2.3. Market Opportunity Analysis |
| 6.Asia Pacific Capnography Devices Market By Technology, 2018 - 2022 and Forecast 2023 - 2029 (Sales Value USD Million) |
| 6.1. Hand-Held Monitors |
| 6.1.1. Market Analysis, 2018 - 2022 and Forecast, 2023 - 2029, (Sales Value USD Million) |
| 6.1.2. Year-Over-Year (Y-o-Y) Growth Analysis (%) and Market Share Analysis (%) |
| 6.1.3. Market Opportunity Analysis |
| 6.2. Stand-Alone Monitors |
| 6.2.1. Market Analysis, 2018 - 2022 and Forecast, 2023 - 2029, (Sales Value USD Million) |
| 6.2.2. Year-Over-Year (Y-o-Y) Growth Analysis (%) and Market Share Analysis (%) |
| 6.2.3. Market Opportunity Analysis |
| 6.3. Others |
| 6.3.1. Market Analysis, 2018 - 2022 and Forecast, 2023 - 2029, (Sales Value USD Million) |
| 6.3.2. Year-Over-Year (Y-o-Y) Growth Analysis (%) and Market Share Analysis (%) |
| 6.3.3. Market Opportunity Analysis |
| 7.Asia Pacific Capnography Devices Market By Application, 2018 - 2022 and Forecast 2023 - 2029 (Sales Value USD Million) |
| 7.1. Anesthesia |
| 7.1.1. Market Analysis, 2018 - 2022 and Forecast, 2023 - 2029, (Sales Value USD Million) |
| 7.1.2. Year-Over-Year (Y-o-Y) Growth Analysis (%) and Market Share Analysis (%) |
| 7.1.3. Market Opportunity Analysis |
| 7.2. Procedural Sedation |
| 7.2.1. Market Analysis, 2018 - 2022 and Forecast, 2023 - 2029, (Sales Value USD Million) |
| 7.2.2. Year-Over-Year (Y-o-Y) Growth Analysis (%) and Market Share Analysis (%) |
| 7.2.3. Market Opportunity Analysis |
| 7.3. Intensive Care |
| 7.3.1. Market Analysis, 2018 - 2022 and Forecast, 2023 - 2029, (Sales Value USD Million) |
| 7.3.2. Year-Over-Year (Y-o-Y) Growth Analysis (%) and Market Share Analysis (%) |
| 7.3.3. Market Opportunity Analysis |
| 7.4. Pain Management |
| 7.4.1. Market Analysis, 2018 - 2022 and Forecast, 2023 - 2029, (Sales Value USD Million) |
| 7.4.2. Year-Over-Year (Y-o-Y) Growth Analysis (%) and Market Share Analysis (%) |
| 7.4.3. Market Opportunity Analysis |
| 7.5. Emergency Medicine |
| 7.5.1. Market Analysis, 2018 - 2022 and Forecast, 2023 - 2029, (Sales Value USD Million) |
| 7.5.2. Year-Over-Year (Y-o-Y) Growth Analysis (%) and Market Share Analysis (%) |
| 7.5.3. Market Opportunity Analysis |
| 7.6. Others |
| 7.6.1. Market Analysis, 2018 - 2022 and Forecast, 2023 - 2029, (Sales Value USD Million) |
| 7.6.2. Year-Over-Year (Y-o-Y) Growth Analysis (%) and Market Share Analysis (%) |
| 7.6.3. Market Opportunity Analysis |
| 8.Asia Pacific Capnography Devices Market By End User, 2018 - 2022 and Forecast 2023 - 2029 (Sales Value USD Million) |
| 8.1. Hospitals |
| 8.1.1. Market Analysis, 2018 - 2022 and Forecast, 2023 - 2029, (Sales Value USD Million) |
| 8.1.2. Year-Over-Year (Y-o-Y) Growth Analysis (%) and Market Share Analysis (%) |
| 8.1.3. Market Opportunity Analysis |
| 8.2. Clinics |
| 8.2.1. Market Analysis, 2018 - 2022 and Forecast, 2023 - 2029, (Sales Value USD Million) |
| 8.2.2. Year-Over-Year (Y-o-Y) Growth Analysis (%) and Market Share Analysis (%) |
| 8.2.3. Market Opportunity Analysis |
| 8.3. Ambulatory Surgical Centers |
| 8.3.1. Market Analysis, 2018 - 2022 and Forecast, 2023 - 2029, (Sales Value USD Million) |
| 8.3.2. Year-Over-Year (Y-o-Y) Growth Analysis (%) and Market Share Analysis (%) |
| 8.3.3. Market Opportunity Analysis |
| 9.Asia Pacific Capnography Devices Market By Country, 2018 - 2022 and Forecast 2023 - 2029 (Sales Value USD Million) |
| 9.1. China |
| 9.1.1. Market Analysis, 2018 - 2022 and Forecast, 2023 - 2029, (Sales Value USD Million) |
| 9.1.2. Year-Over-Year (Y-o-Y) Growth Analysis (%) and Market Share Analysis (%) |
| 9.1.3. Market Opportunity Analysis |
| 9.2. India |
| 9.2.1. Market Analysis, 2018 - 2022 and Forecast, 2023 - 2029, (Sales Value USD Million) |
| 9.2.2. Year-Over-Year (Y-o-Y) Growth Analysis (%) and Market Share Analysis (%) |
| 9.2.3. Market Opportunity Analysis |
| 9.3. Australia and New Zealand (ANZ) |
| 9.3.1. Market Analysis, 2018 - 2022 and Forecast, 2023 - 2029, (Sales Value USD Million) |
| 9.3.2. Year-Over-Year (Y-o-Y) Growth Analysis (%) and Market Share Analysis (%) |
| 9.3.3. Market Opportunity Analysis |
| 9.4. Japan |
| 9.4.1. Market Analysis, 2018 - 2022 and Forecast, 2023 - 2029, (Sales Value USD Million) |
| 9.4.2. Year-Over-Year (Y-o-Y) Growth Analysis (%) and Market Share Analysis (%) |
| 9.4.3. Market Opportunity Analysis |
| 9.5. Rest of APAC |
| 9.5.1. Market Analysis, 2018 - 2022 and Forecast, 2023 - 2029, (Sales Value USD Million) |
| 9.5.2. Year-Over-Year (Y-o-Y) Growth Analysis (%) and Market Share Analysis (%) |
| 9.5.3. Market Opportunity Analysis |
| 10.China Capnography Devices Market ,2018 - 2022 and Forecast 2023 - 2029 (Sales Value USD Million) |
| 10.1. Product Type Analysis 2018 - 2022 and Forecast 2023 - 2029 by Sales Value USD Million, Y-o-Y Growth (%), and Market Share (%) |
| 10.1.1.Capnographs |
| 10.1.2.Disposables |
| 10.2. Technology Analysis 2018 - 2022 and Forecast 2023 - 2029 by Sales Value USD Million, Y-o-Y Growth (%), and Market Share (%) |
| 10.2.1.Hand-Held Monitors |
| 10.2.2.Stand-Alone Monitors |
| 10.2.3.Others |
| 10.3. Application Analysis 2018 - 2022 and Forecast 2023 - 2029 by Sales Value USD Million, Y-o-Y Growth (%), and Market Share (%) |
| 10.3.1.Anesthesia |
| 10.3.2.Procedural Sedation |
| 10.3.3.Intensive Care |
| 10.3.4.Pain Management |
| 10.3.5.Emergency Medicine |
| 10.3.6.Others |
| 10.4. End User Analysis 2018 - 2022 and Forecast 2023 - 2029 by Sales Value USD Million, Y-o-Y Growth (%), and Market Share (%) |
| 10.4.1.Hospitals |
| 10.4.2.Clinics |
| 10.4.3.Ambulatory Surgical Centers |
| 10.5. Country Analysis 2018 - 2022 and Forecast 2023 - 2029 by Sales Value USD Million, Y-o-Y Growth (%), and Market Share (%) |
| 11.India Capnography Devices Market ,2018 - 2022 and Forecast 2023 - 2029 (Sales Value USD Million) |
| 11.1. Product Type Analysis and Forecast by Sales Value USD Million, Y-o-Y Growth (%), and Market Share (%) |
| 11.1.1.Capnographs |
| 11.1.2.Disposables |
| 11.2. Technology Analysis 2018 - 2022 and Forecast 2023 - 2029 by Sales Value USD Million, Y-o-Y Growth (%), and Market Share (%) |
| 11.2.1.Hand-Held Monitors |
| 11.2.2.Stand-Alone Monitors |
| 11.2.3.Others |
| 11.3. Application Analysis 2018 - 2022 and Forecast 2023 - 2029 by Sales Value USD Million, Y-o-Y Growth (%), and Market Share (%) |
| 11.3.1.Anesthesia |
| 11.3.2.Procedural Sedation |
| 11.3.3.Intensive Care |
| 11.3.4.Pain Management |
| 11.3.5.Emergency Medicine |
| 11.3.6.Others |
| 11.4. End User Analysis 2018 - 2022 and Forecast 2023 - 2029 by Sales Value USD Million, Y-o-Y Growth (%), and Market Share (%) |
| 11.4.1.Hospitals |
| 11.4.2.Clinics |
| 11.4.3.Ambulatory Surgical Centers |
| 11.5. Country Analysis 2018 - 2022 and Forecast 2023 - 2029 by Sales Value USD Million, Y-o-Y Growth (%), and Market Share (%) |
| 12.Australia and New Zealand (ANZ) Capnography Devices Market ,2018 - 2022 and Forecast 2023 - 2029 (Sales Value USD Million) |
| 12.1. Product Type Analysis and Forecast by Sales Value USD Million, Y-o-Y Growth (%), and Market Share (%) |
| 12.1.1.Capnographs |
| 12.1.2.Disposables |
| 12.2. Technology Analysis 2018 - 2022 and Forecast 2023 - 2029 by Sales Value USD Million, Y-o-Y Growth (%), and Market Share (%) |
| 12.2.1.Hand-Held Monitors |
| 12.2.2.Stand-Alone Monitors |
| 12.2.3.Others |
| 12.3. Application Analysis 2018 - 2022 and Forecast 2023 - 2029 by Sales Value USD Million, Y-o-Y Growth (%), and Market Share (%) |
| 12.3.1.Anesthesia |
| 12.3.2.Procedural Sedation |
| 12.3.3.Intensive Care |
| 12.3.4.Pain Management |
| 12.3.5.Emergency Medicine |
| 12.3.6.Others |
| 12.4. End User Analysis 2018 - 2022 and Forecast 2023 - 2029 by Sales Value USD Million, Y-o-Y Growth (%), and Market Share (%) |
| 12.4.1.Hospitals |
| 12.4.2.Clinics |
| 12.4.3.Ambulatory Surgical Centers |
| 12.5. Country Analysis 2018 - 2022 and Forecast 2023 - 2029 by Sales Value USD Million, Y-o-Y Growth (%), and Market Share (%) |
| 13.Japan Capnography Devices Market ,2018 - 2022 and Forecast 2023 - 2029 (Sales Value USD Million) |
| 13.1. Product Type Analysis and Forecast by Sales Value USD Million, Y-o-Y Growth (%), and Market Share (%) |
| 13.1.1.Capnographs |
| 13.1.2.Disposables |
| 13.2. Technology Analysis 2018 - 2022 and Forecast 2023 - 2029 by Sales Value USD Million, Y-o-Y Growth (%), and Market Share (%) |
| 13.2.1.Hand-Held Monitors |
| 13.2.2.Stand-Alone Monitors |
| 13.2.3.Others |
| 13.3. Application Analysis 2018 - 2022 and Forecast 2023 - 2029 by Sales Value USD Million, Y-o-Y Growth (%), and Market Share (%) |
| 13.3.1.Anesthesia |
| 13.3.2.Procedural Sedation |
| 13.3.3.Intensive Care |
| 13.3.4.Pain Management |
| 13.3.5.Emergency Medicine |
| 13.3.6.Others |
| 13.4. End User Analysis 2018 - 2022 and Forecast 2023 - 2029 by Sales Value USD Million, Y-o-Y Growth (%), and Market Share (%) |
| 13.4.1.Hospitals |
| 13.4.2.Clinics |
| 13.4.3.Ambulatory Surgical Centers |
| 13.5. Country Analysis 2018 - 2022 and Forecast 2023 - 2029 by Sales Value USD Million, Y-o-Y Growth (%), and Market Share (%) |
| 14.Rest of APAC Capnography Devices Market ,2018 - 2022 and Forecast 2023 - 2029 (Sales Value USD Million) |
| 14.1. Product Type Analysis and Forecast by Sales Value USD Million, Y-o-Y Growth (%), and Market Share (%) |
| 14.1.1.Capnographs |
| 14.1.2.Disposables |
| 14.2. Technology Analysis 2018 - 2022 and Forecast 2023 - 2029 by Sales Value USD Million, Y-o-Y Growth (%), and Market Share (%) |
| 14.2.1.Hand-Held Monitors |
| 14.2.2.Stand-Alone Monitors |
| 14.2.3.Others |
| 14.3. Application Analysis 2018 - 2022 and Forecast 2023 - 2029 by Sales Value USD Million, Y-o-Y Growth (%), and Market Share (%) |
| 14.3.1.Anesthesia |
| 14.3.2.Procedural Sedation |
| 14.3.3.Intensive Care |
| 14.3.4.Pain Management |
| 14.3.5.Emergency Medicine |
| 14.3.6.Others |
| 14.4. End User Analysis 2018 - 2022 and Forecast 2023 - 2029 by Sales Value USD Million, Y-o-Y Growth (%), and Market Share (%) |
| 14.4.1.Hospitals |
| 14.4.2.Clinics |
| 14.4.3.Ambulatory Surgical Centers |
| 14.5. Country Analysis 2018 - 2022 and Forecast 2023 - 2029 by Sales Value USD Million, Y-o-Y Growth (%), and Market Share (%) |
| 15. Competition Landscape |
| 15.1. Market Player Profiles (Introduction, Brand/Product Sales, Financial Analysis, Product Offerings, Key Developments, Collaborations, M & A, Strategies, and SWOT Analysis) |
| 15.2.1.Masimo Corporation |
| 15.2.2.Covidien plc |
| 15.2.3.Nihon Kohden Corporatio |
| 15.2.4.Smiths Medical, Inc. |
| 15.2.5.Welch Allyn Inc. |
| 15.2.6.Koninklijke Philips N.V. |
| 15.2.7.Dragerwerk AG & Co. KGaA |
| 16. Research Methodology |
| 17. Appendix and Abbreviations |
- Masimo Corporation
- Covidien plc
- Nihon Kohden Corporatio
- Smiths Medical, Inc.
- Welch Allyn Inc.
- Koninklijke Philips N.V.
- Dragerwerk AG & Co. KGaA
