- Diabetes
- Obesity
- CVD
- CNS disease
- Respiratory disease
- Smoking cessation
- Others
Digital Therapeutics and Wellness Market was estimated at USD 2.6 billion in 2022 and is projected to cross USD 10.9 billion in 2028, at a Significant CAGR of 19.7% from 2023-2029. Demand for global digital therapeutics is increasing as a result of increasing mobile and tablet adoption, combined with healthcare apps growing need to monitor healthcare costs and increasing incidence of chronic diseases. However, lack of understanding in developed countries about digital therapy and concerns about patient data privacy hinder the growth of the digital therapy industry. On the contrary, it is expected that high growth prospects in untapped markets would create significant profitable opportunities for producers in the digital therapeutics and wellness market. The general public has become more conscious of the continuously shifting digital scene. Furthermore, the market is fueled by rising chronic disease prevalence and rapid technology improvements. End-user awareness is predicted to rise as a result of the use of digital devices and solutions, propelling the industry forward. Consumer attitudes toward digital health are predicted to continue to alter, as will their demand for accessible, personalised, and engaging medical solutions. Another key technological driver for the market for digital therapeutics is the rise in smartphone and internet usage among consumers.
Digital Therapeutics And Wellness Market Summary
Study Period
2024-2030
Base Year
2023
CAGR
19.7%
Largest Market
North America
Fastest Growing Market
Asia-Pacific
Digital Therapeutics and Wellness Market Dynamics
One of the significant drivers for the digital therapeutic market is the growing use of Smartphone and internet between people. India, for example, was ranked 47th in 2013 by Google for Smartphone penetration, and 36th in 2015. As healthcare has become more costly, digital treatments provide cost savings for patients and reduce hospital visits. Mobile devices & consultation provide a safer way to care for patients with chronic illnesses. In addition, the US FDA approved a mobile application in 2017 to facilitate the treatment of substance-use disorders (SUD). The Smartphone device is used for the treatment of alcohol, cocaine, marijuana and stimulant SUDs with ambulatory therapy.
Key Features of the Reports

Digital Therapeutics And Wellness Market Segmentation
By Application
By End User
- Patients
- Providers
- Payers
- Employers
- Others
By Geography
North America
- US.
- Canada
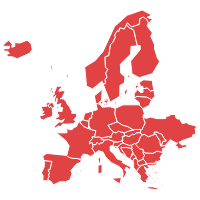
Europe
- Germany
- UK.
- France
- Spain
- Italy
- Rest of Europe
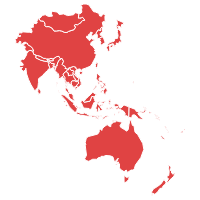
Asia-Pacific
- China
- India
- Japan
- Australia & New Zealand
- Rest of APAC
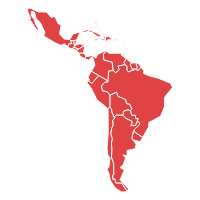
Latin America
- Brazil
- Mexico
- Argentina
- Rest of LATAM
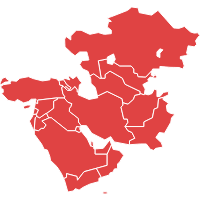
MEA
- South Africa
- GCC Countries
- Turkey
- Rest of MEA
Frequently Asked Questions
The digital therapeutics and wellness market size was valued at USD 2.6 billion in 2022.
The digital therapeutics and wellness market has been classified into North America, Asia Pacific, Europe, Latin America, Middle East and Africa, and the rest of MEA.
The digital therapeutics and wellness market key players are Proteus Digital Health Inc, Omada Health Inc, WellDoc Inc, 2Morrow Inc, Livongo Health, Propeller Health, Canaray Health, Twine Health Inc, Mango Health Inc
| 1.Executive Summary |
| 2.Global Digital Therapeutics and Wellness Market Introduction |
| 2.1.Global Digital Therapeutics and Wellness Market - Taxonomy |
| 2.2.Global Digital Therapeutics and Wellness Market - Definitions |
| 2.2.1.Application |
| 2.2.2.End User |
| 2.2.3.Region |
| 3.Global Digital Therapeutics and Wellness Market Dynamics |
| 3.1. Drivers |
| 3.2. Restraints |
| 3.3. Opportunities/Unmet Needs of the Market |
| 3.4. Trends |
| 3.5. Product Landscape |
| 3.6. New Product Launches |
| 3.7. Impact of COVID 19 on Market |
| 4.Global Digital Therapeutics and Wellness Market Analysis, 2018 - 2022 and Forecast 2023 - 2029 |
| 4.1. Market Analysis, 2018 - 2022 and Forecast, 2023 - 2029, (Sales Value USD Million) |
| 4.2. Year-Over-Year (Y-o-Y) Growth Analysis (%) |
| 4.3. Market Opportunity Analysis |
| 5.Global Digital Therapeutics and Wellness Market By Application, 2018 - 2022 and Forecast 2023 - 2029 (Sales Value USD Million) |
| 5.1. Diabetes |
| 5.1.1. Market Analysis, 2018 - 2022 and Forecast, 2023 - 2029, (Sales Value USD Million) |
| 5.1.2. Year-Over-Year (Y-o-Y) Growth Analysis (%) and Market Share Analysis (%) |
| 5.1.3. Market Opportunity Analysis |
| 5.2. Obesity |
| 5.2.1. Market Analysis, 2018 - 2022 and Forecast, 2023 - 2029, (Sales Value USD Million) |
| 5.2.2. Year-Over-Year (Y-o-Y) Growth Analysis (%) and Market Share Analysis (%) |
| 5.2.3. Market Opportunity Analysis |
| 5.3. CVD |
| 5.3.1. Market Analysis, 2018 - 2022 and Forecast, 2023 - 2029, (Sales Value USD Million) |
| 5.3.2. Year-Over-Year (Y-o-Y) Growth Analysis (%) and Market Share Analysis (%) |
| 5.3.3. Market Opportunity Analysis |
| 5.4. CNS disease |
| 5.4.1. Market Analysis, 2018 - 2022 and Forecast, 2023 - 2029, (Sales Value USD Million) |
| 5.4.2. Year-Over-Year (Y-o-Y) Growth Analysis (%) and Market Share Analysis (%) |
| 5.4.3. Market Opportunity Analysis |
| 5.5. Respiratory disease |
| 5.5.1. Market Analysis, 2018 - 2022 and Forecast, 2023 - 2029, (Sales Value USD Million) |
| 5.5.2. Year-Over-Year (Y-o-Y) Growth Analysis (%) and Market Share Analysis (%) |
| 5.5.3. Market Opportunity Analysis |
| 5.6. Smoking cessation |
| 5.6.1. Market Analysis, 2018 - 2022 and Forecast, 2023 - 2029, (Sales Value USD Million) |
| 5.6.2. Year-Over-Year (Y-o-Y) Growth Analysis (%) and Market Share Analysis (%) |
| 5.6.3. Market Opportunity Analysis |
| 5.7. Others |
| 5.7.1. Market Analysis, 2018 - 2022 and Forecast, 2023 - 2029, (Sales Value USD Million) |
| 5.7.2. Year-Over-Year (Y-o-Y) Growth Analysis (%) and Market Share Analysis (%) |
| 5.7.3. Market Opportunity Analysis |
| 6.Global Digital Therapeutics and Wellness Market By End User, 2018 - 2022 and Forecast 2023 - 2029 (Sales Value USD Million) |
| 6.1. Patients |
| 6.1.1. Market Analysis, 2018 - 2022 and Forecast, 2023 - 2029, (Sales Value USD Million) |
| 6.1.2. Year-Over-Year (Y-o-Y) Growth Analysis (%) and Market Share Analysis (%) |
| 6.1.3. Market Opportunity Analysis |
| 6.2. Providers |
| 6.2.1. Market Analysis, 2018 - 2022 and Forecast, 2023 - 2029, (Sales Value USD Million) |
| 6.2.2. Year-Over-Year (Y-o-Y) Growth Analysis (%) and Market Share Analysis (%) |
| 6.2.3. Market Opportunity Analysis |
| 6.3. Payers |
| 6.3.1. Market Analysis, 2018 - 2022 and Forecast, 2023 - 2029, (Sales Value USD Million) |
| 6.3.2. Year-Over-Year (Y-o-Y) Growth Analysis (%) and Market Share Analysis (%) |
| 6.3.3. Market Opportunity Analysis |
| 6.4. Employers |
| 6.4.1. Market Analysis, 2018 - 2022 and Forecast, 2023 - 2029, (Sales Value USD Million) |
| 6.4.2. Year-Over-Year (Y-o-Y) Growth Analysis (%) and Market Share Analysis (%) |
| 6.4.3. Market Opportunity Analysis |
| 6.5. Others |
| 6.5.1. Market Analysis, 2018 - 2022 and Forecast, 2023 - 2029, (Sales Value USD Million) |
| 6.5.2. Year-Over-Year (Y-o-Y) Growth Analysis (%) and Market Share Analysis (%) |
| 6.5.3. Market Opportunity Analysis |
| 7.Global Digital Therapeutics and Wellness Market By Region, 2018 - 2022 and Forecast 2023 - 2029 (Sales Value USD Million) |
| 7.1. North America |
| 7.1.1. Market Analysis, 2018 - 2022 and Forecast, 2023 - 2029, (Sales Value USD Million) |
| 7.1.2. Year-Over-Year (Y-o-Y) Growth Analysis (%) and Market Share Analysis (%) |
| 7.1.3. Market Opportunity Analysis |
| 7.2. Europe |
| 7.2.1. Market Analysis, 2018 - 2022 and Forecast, 2023 - 2029, (Sales Value USD Million) |
| 7.2.2. Year-Over-Year (Y-o-Y) Growth Analysis (%) and Market Share Analysis (%) |
| 7.2.3. Market Opportunity Analysis |
| 7.3. Asia Pacific (APAC) |
| 7.3.1. Market Analysis, 2018 - 2022 and Forecast, 2023 - 2029, (Sales Value USD Million) |
| 7.3.2. Year-Over-Year (Y-o-Y) Growth Analysis (%) and Market Share Analysis (%) |
| 7.3.3. Market Opportunity Analysis |
| 7.4. Middle East and Africa (MEA) |
| 7.4.1. Market Analysis, 2018 - 2022 and Forecast, 2023 - 2029, (Sales Value USD Million) |
| 7.4.2. Year-Over-Year (Y-o-Y) Growth Analysis (%) and Market Share Analysis (%) |
| 7.4.3. Market Opportunity Analysis |
| 7.5. Latin America |
| 7.5.1. Market Analysis, 2018 - 2022 and Forecast, 2023 - 2029, (Sales Value USD Million) |
| 7.5.2. Year-Over-Year (Y-o-Y) Growth Analysis (%) and Market Share Analysis (%) |
| 7.5.3. Market Opportunity Analysis |
| 8.North America Digital Therapeutics and Wellness Market ,2018 - 2022 and Forecast 2023 - 2029 (Sales Value USD Million) |
| 8.1. Application Analysis 2018 - 2022 and Forecast 2023 - 2029 by Sales Value USD Million, Y-o-Y Growth (%), and Market Share (%) |
| 8.1.1.Diabetes |
| 8.1.2.Obesity |
| 8.1.3.CVD |
| 8.1.4.CNS disease |
| 8.1.5.Respiratory disease |
| 8.1.6.Smoking cessation |
| 8.1.7.Others |
| 8.2. End User Analysis 2018 - 2022 and Forecast 2023 - 2029 by Sales Value USD Million, Y-o-Y Growth (%), and Market Share (%) |
| 8.2.1.Patients |
| 8.2.2.Providers |
| 8.2.3.Payers |
| 8.2.4.Employers |
| 8.2.5.Others |
| 8.3. Country Analysis 2018 - 2022 and Forecast 2023 - 2029 by Sales Value USD Million, Y-o-Y Growth (%), and Market Share (%) |
| 8.3.1.United States of America (USA) |
| 8.3.2.Canada |
| 9.Europe Digital Therapeutics and Wellness Market ,2018 - 2022 and Forecast 2023 - 2029 (Sales Value USD Million) |
| 9.1. Application Analysis and Forecast by Sales Value USD Million, Y-o-Y Growth (%), and Market Share (%) |
| 9.1.1.Diabetes |
| 9.1.2.Obesity |
| 9.1.3.CVD |
| 9.1.4.CNS disease |
| 9.1.5.Respiratory disease |
| 9.1.6.Smoking cessation |
| 9.1.7.Others |
| 9.2. End User Analysis 2018 - 2022 and Forecast 2023 - 2029 by Sales Value USD Million, Y-o-Y Growth (%), and Market Share (%) |
| 9.2.1.Patients |
| 9.2.2.Providers |
| 9.2.3.Payers |
| 9.2.4.Employers |
| 9.2.5.Others |
| 9.3. Country Analysis 2018 - 2022 and Forecast 2023 - 2029 by Sales Value USD Million, Y-o-Y Growth (%), and Market Share (%) |
| 9.3.1.Germany |
| 9.3.2.France |
| 9.3.3.Italy |
| 9.3.4.United Kingdom (UK) |
| 9.3.5.Spain |
| 9.3.6.Rest of EU |
| 10.Asia Pacific (APAC) Digital Therapeutics and Wellness Market ,2018 - 2022 and Forecast 2023 - 2029 (Sales Value USD Million) |
| 10.1. Application Analysis and Forecast by Sales Value USD Million, Y-o-Y Growth (%), and Market Share (%) |
| 10.1.1.Diabetes |
| 10.1.2.Obesity |
| 10.1.3.CVD |
| 10.1.4.CNS disease |
| 10.1.5.Respiratory disease |
| 10.1.6.Smoking cessation |
| 10.1.7.Others |
| 10.2. End User Analysis 2018 - 2022 and Forecast 2023 - 2029 by Sales Value USD Million, Y-o-Y Growth (%), and Market Share (%) |
| 10.2.1.Patients |
| 10.2.2.Providers |
| 10.2.3.Payers |
| 10.2.4.Employers |
| 10.2.5.Others |
| 10.3. Country Analysis 2018 - 2022 and Forecast 2023 - 2029 by Sales Value USD Million, Y-o-Y Growth (%), and Market Share (%) |
| 10.3.1.China |
| 10.3.2.India |
| 10.3.3.Australia and New Zealand (ANZ) |
| 10.3.4.Japan |
| 10.3.5.Rest of APAC |
| 11.Middle East and Africa (MEA) Digital Therapeutics and Wellness Market ,2018 - 2022 and Forecast 2023 - 2029 (Sales Value USD Million) |
| 11.1. Application Analysis and Forecast by Sales Value USD Million, Y-o-Y Growth (%), and Market Share (%) |
| 11.1.1.Diabetes |
| 11.1.2.Obesity |
| 11.1.3.CVD |
| 11.1.4.CNS disease |
| 11.1.5.Respiratory disease |
| 11.1.6.Smoking cessation |
| 11.1.7.Others |
| 11.2. End User Analysis 2018 - 2022 and Forecast 2023 - 2029 by Sales Value USD Million, Y-o-Y Growth (%), and Market Share (%) |
| 11.2.1.Patients |
| 11.2.2.Providers |
| 11.2.3.Payers |
| 11.2.4.Employers |
| 11.2.5.Others |
| 11.3. Country Analysis 2018 - 2022 and Forecast 2023 - 2029 by Sales Value USD Million, Y-o-Y Growth (%), and Market Share (%) |
| 11.3.1.GCC Countries |
| 11.3.2.South Africa |
| 11.3.3.Rest of MEA |
| 12.Latin America Digital Therapeutics and Wellness Market ,2018 - 2022 and Forecast 2023 - 2029 (Sales Value USD Million) |
| 12.1. Application Analysis and Forecast by Sales Value USD Million, Y-o-Y Growth (%), and Market Share (%) |
| 12.1.1.Diabetes |
| 12.1.2.Obesity |
| 12.1.3.CVD |
| 12.1.4.CNS disease |
| 12.1.5.Respiratory disease |
| 12.1.6.Smoking cessation |
| 12.1.7.Others |
| 12.2. End User Analysis 2018 - 2022 and Forecast 2023 - 2029 by Sales Value USD Million, Y-o-Y Growth (%), and Market Share (%) |
| 12.2.1.Patients |
| 12.2.2.Providers |
| 12.2.3.Payers |
| 12.2.4.Employers |
| 12.2.5.Others |
| 12.3. Country Analysis 2018 - 2022 and Forecast 2023 - 2029 by Sales Value USD Million, Y-o-Y Growth (%), and Market Share (%) |
| 12.3.1.Brazil |
| 12.3.2.Mexico |
| 12.3.3.Rest of LA |
| 13. Competition Landscape |
| 13.1. Market Player Profiles (Introduction, Brand/Product Sales, Financial Analysis, Product Offerings, Key Developments, Collaborations, M & A, Strategies, and SWOT Analysis) |
| 13.2.1.Proteus Digital Health Inc |
| 13.2.2.Omada Health Inc |
| 13.2.3.WellDoc Inc |
| 13.2.4.2Morrow Inc |
| 13.2.5.Livongo Health |
| 13.2.6.Propeller Health |
| 13.2.7.Canaray Health |
| 13.2.8.Twine Health Inc |
| 13.2.9.Mango Health Inc |
| 14. Research Methodology |
| 15. Appendix and Abbreviations |
- Proteus Digital Health Inc
- Omada Health Inc
- WellDoc Inc
- 2Morrow Inc
- Livongo Health
- Propeller Health
- Canaray Health
- Twine Health Inc
- Mango Health Inc
