- Halogen Compounds
- Quaternary Ammonium Compounds
- Metallic Compounds
- Phenolic
- Organic Acids
- Organosulfur
- Others
Biocides Market size was valued at USD 7,591.2 million in 2022 and is poised to grow at a significant CAGR of 4.4% over 2023-2029. Biocides are chemicals used to disinfect, kill, and inhibit the growth of microorganisms such as fungus, bacteria, and viruses. This substance is typically mixed with other materials for use in consumer goods, paints and coatings, and water treatment sectors. Based on their raw material source, they are classified as natural biocide or synthetic biocide. Increasing consumer awareness of cleanliness and self-hygiene is driving up product demand. Moreover, people's sensitivity to allergens and dust is opening up new markets for biocides. The widespread use of wood in buildings in the residential, commercial, and industrial sectors has aided the spread of biocides in wood preservation. However, during the last few years, product usage has revealed negative health impacts, leading to public health worries. Chemical Ranking and Scoring (CRS) procedures have been implemented internationally for effective product management to restrict the movement of biocides and monitor the consumption and handling of diverse biocide products. CRS gives data on aspects such as toxicity and exposure to different biocide agents. Many governments in all main areas have implemented rules and regulations to reduce the negative impacts of biocides, which can stifle market growth.
Biocides Market Key Developments:
- In May 2022, LANXESS AG purchased the microbial control business unit of International Flavors & Fragrances Inc., a US-based company (IFF Inc.). This purchase will assist LANXESS AG in expanding its biocidal active ingredient portfolio and microbial control business.
Global Biocides Market Summary
Study Period
2024-2030
Base Year
2023
CAGR
4.4%
Largest Market
Asia Pacific
Fastest Growing Market
North-America
Biocides Market Dynamics
Biocides are increasingly being used in a variety of sectors. Cooling towers are an important application area for biocides in power plants, mining, and chemical facilities, as cooling water systems provide an ideal habitat for microbe development. Slime formation refers to the uncontrolled development of microorganisms on surfaces. Slimes are made up of both biological and non-biological components. The biological component is called biofilm, and it is made up of microbial cells and their byproducts.
Key Features of the Reports
- The biocides market report provides granular level information about market size, regional market share, historic market (2018-2022) and forecast (2023-2029).
- The report outlines drivers, restraints, unmet needs, and trends that are currently affecting the market.
- The report tracks recent innovations, key developments and startup’s details that are actively working in the market.
- The report provides plethora of information about market entry strategies.

Global Biocides Market Segmentation
By Type
By Application
- Water Treatment
- Food and Personal Care Products
- Cleaning Products
- Furniture and Furnishings
- Clothing and Textiles
- Leather and Suede
- Paints and Coatings
- Fuel Preservatives
- Others
By Geography
- North America
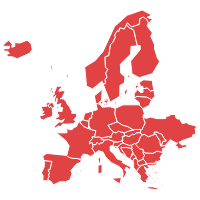
- Europe
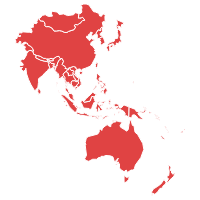
- Asia Pacific
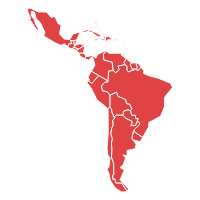
- Latin America
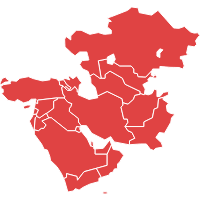
- MEA
Frequently Asked Questions
The increasing demand from the paints & coatings industry is expected to drive market growth.
Vink Chemicals GmbH & Co. KG, Thor Group Limited, and Lanxess AG are a few leading market players.
High demand from the consumer for household cleaner, food & personal care products along with the rising medical application is an important market trend.
Asia Pacific dominated the global market in 2022.
| 1. Executive Summary |
| 2. Global Biocides Market Introduction |
| 2.1. Global Biocides Market – Taxonomy |
| 2.2. Global Biocides Market –Definitions |
| 2.2.1. Type |
| 2.2.2. Application |
| 2.2.3. Region |
| 3. Global Biocides Market Dynamics |
| 3.1. Drivers |
| 3.2. Restraints |
| 3.3. Opportunities/Unmet Needs of the Market |
| 3.4. Trends |
| 3.5. Global Biocides Market Dynamic Factors - Impact Analysis |
| 3.6. Impact of COVID 19 on The Market |
| 3.7. Three Forecast Scenarios - Pessimistic, Conservative and Opportunistic |
| 3.8. Mapping Market Players Activities |
| 3.9. Recent Key Developments |
| 3.10. Financial Status of the Market Players |
| 3.11. Recent Acquisitions, Collaborations and Mergers |
| 4. Global Biocides Market Analysis, 2018 - 2022 and Forecast, 2023 - 2029 |
| 4.1. Market Analysis, 2018 - 2022 and Forecast, 2023 - 2029 (Revenue, USD Million) |
| 4.2. Year-over-Year (Y-o-Y) Growth Analysis (%) |
| 4.3. Market Opportunity Analysis |
| 5. Global Biocides Market Forecast, By Type, 2018 - 2022 and Forecast, 2023 - 2029 (Revenue, USD Million) |
| 5.1. Halogen Compounds |
| 5.1.1. Market Analysis, 2018 - 2022 and Forecast, 2023 - 2029 (Revenue, USD Million) |
| 5.1.2. Year-over-Year (Y-o-Y) Growth Analysis (%) and Market Share Analysis (%) |
| 5.1.3. Market Opportunity Analysis |
| 5.2. Quaternary Ammonium Compounds |
| 5.2.1. Market Analysis, 2018 - 2022 and Forecast, 2023 - 2029 (Revenue, USD Million) |
| 5.2.2. Year-over-Year (Y-o-Y) Growth Analysis (%) and Market Share Analysis (%) |
| 5.2.3. Market Opportunity Analysis |
| 5.3. Metallic Compounds |
| 5.3.1. Market Analysis, 2018 - 2022 and Forecast, 2023 - 2029 (Revenue, USD Million) |
| 5.3.2. Year-over-Year (Y-o-Y) Growth Analysis (%) and Market Share Analysis (%) |
| 5.3.3. Market Opportunity Analysis |
| 5.4. Phenolic |
| 5.4.1. Market Analysis, 2018 - 2022 and Forecast, 2023 - 2029 (Revenue, USD Million) |
| 5.4.2. Year-over-Year (Y-o-Y) Growth Analysis (%) and Market Share Analysis (%) |
| 5.4.3. Market Opportunity Analysis |
| 5.5. Organic Acids |
| 5.5.1. Market Analysis, 2018 - 2022 and Forecast, 2023 - 2029 (Revenue, USD Million) |
| 5.5.2. Year-over-Year (Y-o-Y) Growth Analysis (%) and Market Share Analysis (%) |
| 5.5.3. Market Opportunity Analysis |
| 5.6. Organosulfur |
| 5.6.1. Market Analysis, 2018 - 2022 and Forecast, 2023 - 2029 (Revenue, USD Million) |
| 5.6.2. Year-over-Year (Y-o-Y) Growth Analysis (%) and Market Share Analysis (%) |
| 5.6.3. Market Opportunity Analysis |
| 5.7. Others |
| 5.7.1. Market Analysis, 2018 - 2022 and Forecast, 2023 - 2029 (Revenue, USD Million) |
| 5.7.2. Year-over-Year (Y-o-Y) Growth Analysis (%) and Market Share Analysis (%) |
| 5.7.3. Market Opportunity Analysis |
| 6. Global Biocides Market Forecast, By Application, 2018 - 2022 and Forecast, 2023 - 2029 (Revenue, USD Million) |
| 6.1. Water Treatment |
| 6.1.1. Market Analysis, 2018 - 2022 and Forecast, 2023 - 2029 (Revenue, USD Million) |
| 6.1.2. Year-over-Year (Y-o-Y) Growth Analysis (%) and Market Share Analysis (%) |
| 6.1.3. Market Opportunity Analysis |
| 6.2. Food and Personal Care Products |
| 6.2.1. Market Analysis, 2018 - 2022 and Forecast, 2023 - 2029 (Revenue, USD Million) |
| 6.2.2. Year-over-Year (Y-o-Y) Growth Analysis (%) and Market Share Analysis (%) |
| 6.2.3. Market Opportunity Analysis |
| 6.3. Cleaning Products |
| 6.3.1. Market Analysis, 2018 - 2022 and Forecast, 2023 - 2029 (Revenue, USD Million) |
| 6.3.2. Year-over-Year (Y-o-Y) Growth Analysis (%) and Market Share Analysis (%) |
| 6.3.3. Market Opportunity Analysis |
| 6.4. Furniture and Furnishings |
| 6.4.1. Market Analysis, 2018 - 2022 and Forecast, 2023 - 2029 (Revenue, USD Million) |
| 6.4.2. Year-over-Year (Y-o-Y) Growth Analysis (%) and Market Share Analysis (%) |
| 6.4.3. Market Opportunity Analysis |
| 6.5. Clothing and Textiles |
| 6.5.1. Market Analysis, 2018 - 2022 and Forecast, 2023 - 2029 (Revenue, USD Million) |
| 6.5.2. Year-over-Year (Y-o-Y) Growth Analysis (%) and Market Share Analysis (%) |
| 6.5.3. Market Opportunity Analysis |
| 6.6. Leather and Suede |
| 6.6.1. Market Analysis, 2018 - 2022 and Forecast, 2023 - 2029 (Revenue, USD Million) |
| 6.6.2. Year-over-Year (Y-o-Y) Growth Analysis (%) and Market Share Analysis (%) |
| 6.6.3. Market Opportunity Analysis |
| 6.7. Paints and Coatings |
| 6.7.1. Market Analysis, 2018 - 2022 and Forecast, 2023 - 2029 (Revenue, USD Million) |
| 6.7.2. Year-over-Year (Y-o-Y) Growth Analysis (%) and Market Share Analysis (%) |
| 6.7.3. Market Opportunity Analysis |
| 6.8. Fuel Preservatives |
| 6.8.1. Market Analysis, 2018 - 2022 and Forecast, 2023 - 2029 (Revenue, USD Million) |
| 6.8.2. Year-over-Year (Y-o-Y) Growth Analysis (%) and Market Share Analysis (%) |
| 6.8.3. Market Opportunity Analysis |
| 6.9. Other |
| 6.9.1. Market Analysis, 2018 - 2022 and Forecast, 2023 - 2029 (Revenue, USD Million) |
| 6.9.2. Year-over-Year (Y-o-Y) Growth Analysis (%) and Market Share Analysis (%) |
| 6.9.3. Market Opportunity Analysis |
| 7. Global Biocides Market Forecast, By Region, 2018 - 2022 and Forecast, 2023 - 2029 (Revenue, USD Million) |
| 7.1. North America |
| 7.1.1. Market Analysis, 2018 - 2022 and Forecast, 2023 - 2029 (Revenue, USD Million) |
| 7.1.2. Year-over-Year (Y-o-Y) Growth Analysis (%) and Market Share Analysis (%) |
| 7.1.3. Market Opportunity Analysis |
| 7.2. Europe |
| 7.2.1. Market Analysis, 2018 - 2022 and Forecast, 2023 - 2029 (Revenue, USD Million) |
| 7.2.2. Year-over-Year (Y-o-Y) Growth Analysis (%) and Market Share Analysis (%) |
| 7.2.3. Market Opportunity Analysis |
| 7.3. Asia-Pacific |
| 7.3.1. Market Analysis, 2018 - 2022 and Forecast, 2023 - 2029 (Revenue, USD Million) |
| 7.3.2. Year-over-Year (Y-o-Y) Growth Analysis (%) and Market Share Analysis (%) |
| 7.3.3. Market Opportunity Analysis |
| 7.4. Latin America |
| 7.4.1. Market Analysis, 2018 - 2022 and Forecast, 2023 - 2029 (Revenue, USD Million) |
| 7.4.2. Year-over-Year (Y-o-Y) Growth Analysis (%) and Market Share Analysis (%) |
| 7.4.3. Market Opportunity Analysis |
| 7.5. Middle East and Africa |
| 7.5.1. Market Analysis, 2018 - 2022 and Forecast, 2023 - 2029 (Revenue, USD Million) |
| 7.5.2. Year-over-Year (Y-o-Y) Growth Analysis (%) and Market Share Analysis (%) |
| 7.5.3. Market Opportunity Analysis |
| 7.6. Global Biocides Market - Opportunity Analysis Index, By Type, Distribution Channel, Distribution Channel, and Region, 2023 - 2029 |
| 8. North America Biocides Market Analysis, 2018 - 2022 and Forecast, 2023 - 2029 (Revenue, USD Million) |
| 8.1. Type Analysis 2018 - 2022 and Forecast 2023 - 2029 by Revenue (USD Million), Y-o-Y Growth (%) and Market Share (%) |
| 8.1.1. Halogen Compounds |
| 8.1.2. Quaternary Ammonium Compounds |
| 8.1.3. Metallic Compounds |
| 8.1.4. Phenolic |
| 8.1.5. Organic Acids |
| 8.1.6. Organosulfur |
| 8.1.7. Others |
| 8.2. Application Analysis 2018 - 2022 and Forecast 2023 - 2029 by Revenue (USD Million), Y-o-Y Growth (%) and Market Share (%) |
| 8.2.1. Water Treatment |
| 8.2.2. Food and Personal Care Products |
| 8.2.3. Cleaning Products |
| 8.2.4. Furniture and Furnishings |
| 8.2.5. Clothing and Textiles |
| 8.2.6. Leather and Suede |
| 8.2.7. Paints and Coatings |
| 8.2.8. Fuel Preservatives |
| 8.2.9. Others |
| 8.3. Country Analysis 2018 - 2022 and Forecast 2023 - 2029 by Revenue (USD Million) Y-o-Y Growth (%) and Market Share (%) |
| 8.3.1. U.S. |
| 8.3.2. Canada |
| 8.4. North America Biocides Market - Opportunity Analysis Index, By Type, Application and Country, 2023 - 2029 |
| 8.5. North America Biocides Market Dynamics – Trends |
| 9. Europe Biocides Market Analysis, 2018 - 2022 and Forecast, 2023 - 2029 (Revenue, USD Million) |
| 9.1. Type Analysis 2018 - 2022 and Forecast 2023 - 2029 by Revenue (USD Million), Y-o-Y Growth (%) and Market Share (%) |
| 9.1.1. Halogen Compounds |
| 9.1.2. Quaternary Ammonium Compounds |
| 9.1.3. Metallic Compounds |
| 9.1.4. Phenolic |
| 9.1.5. Organic Acids |
| 9.1.6. Organosulfur |
| 9.1.7. Others |
| 9.2. Application Analysis 2018 - 2022 and Forecast 2023 - 2029 by Revenue (USD Million), Y-o-Y Growth (%) and Market Share (%) |
| 9.2.1. Water Treatment |
| 9.2.2. Food and Personal Care Products |
| 9.2.3. Cleaning Products |
| 9.2.4. Furniture and Furnishings |
| 9.2.5. Clothing and Textiles |
| 9.2.6. Leather and Suede |
| 9.2.7. Paints and Coatings |
| 9.2.8. Fuel Preservatives |
| 9.2.9. Others |
| 9.3. Country Analysis 2018 - 2022 and Forecast 2023 - 2029 by Revenue (USD Million) Y-o-Y Growth (%) and Market Share (%) |
| 9.3.1. Germany |
| 9.3.2. UK |
| 9.3.3. France |
| 9.3.4. Italy |
| 9.3.5. Spain |
| 9.3.6. Rest of Europe |
| 9.4. Europe Biocides Market - Opportunity Analysis Index, By Type, Application and Country, 2023 - 2029 |
| 9.5. Europe Biocides Market Dynamics – Trends |
| 10. Asia-Pacific Biocides Market Analysis, 2018 - 2022 and Forecast, 2023 - 2029 (Revenue, USD Million) |
| 10.1. Type Analysis 2018 - 2022 and Forecast 2023 - 2029 by Revenue (USD Million), Y-o-Y Growth (%) and Market Share (%) |
| 10.1.1. Halogen Compounds |
| 10.1.2. Quaternary Ammonium Compounds |
| 10.1.3. Metallic Compounds |
| 10.1.4. Phenolic |
| 10.1.5. Organic Acids |
| 10.1.6. Organosulfur |
| 10.1.7. Others |
| 10.2. Application Analysis 2018 - 2022 and Forecast 2023 - 2029 by Revenue (USD Million), Y-o-Y Growth (%) and Market Share (%) |
| 10.2.1. Water Treatment |
| 10.2.2. Food and Personal Care Products |
| 10.2.3. Cleaning Products |
| 10.2.4. Furniture and Furnishings |
| 10.2.5. Clothing and Textiles |
| 10.2.6. Leather and Suede |
| 10.2.7. Paints and Coatings |
| 10.2.8. Fuel Preservatives |
| 10.2.9. Others |
| 10.3. Country Analysis 2018 - 2022 and Forecast 2023 - 2029 by Revenue (USD Million) Y-o-Y Growth (%) and Market Share (%) |
| 10.3.1. Japan |
| 10.3.2. China |
| 10.3.3. India |
| 10.3.4. ASEAN |
| 10.3.5. Rest of Asia-Pacific |
| 10.4. Asia-Pacific Biocides Market - Opportunity Analysis Index, By Type, Application and Country, 2023 - 2029 |
| 10.5. Asia-Pacific Biocides Market Dynamics – Trends |
| 11. Latin America Biocides Market Analysis, 2018 - 2022 and Forecast, 2023 - 2029 (Revenue, USD Million) |
| 11.1. Type Analysis 2018 - 2022 and Forecast 2023 - 2029 by Revenue (USD Million), Y-o-Y Growth (%) and Market Share (%) |
| 11.1.1. Halogen Compounds |
| 11.1.2. Quaternary Ammonium Compounds |
| 11.1.3. Metallic Compounds |
| 11.1.4. Phenolic |
| 11.1.5. Organic Acids |
| 11.1.6. Organosulfur |
| 11.1.7. Others |
| 11.2. Application Analysis 2018 - 2022 and Forecast 2023 - 2029 by Revenue (USD Million), Y-o-Y Growth (%) and Market Share (%) |
| 11.2.1. Water Treatment |
| 11.2.2. Food and Personal Care Products |
| 11.2.3. Cleaning Products |
| 11.2.4. Furniture and Furnishings |
| 11.2.5. Clothing and Textiles |
| 11.2.6. Leather and Suede |
| 11.2.7. Paints and Coatings |
| 11.2.8. Fuel Preservatives |
| 11.2.9. Others |
| 11.3. Country Analysis 2018 - 2022 and Forecast 2023 - 2029 by Revenue (USD Million) Y-o-Y Growth (%) and Market Share (%) |
| 11.3.1. Brazil |
| 11.3.2. Argentina |
| 11.3.3. Rest of Latin America |
| 11.4. Latin America Biocides Market - Opportunity Analysis Index, By Type, Application and Country, 2023 - 2029 |
| 11.5. Latin America Biocides Market Dynamics – Trends |
| 12. Middle East and Africa Biocides Market Analysis, 2018 - 2022 and Forecast, 2023 - 2029 (Revenue, USD Million) |
| 12.1. Type Analysis 2018 - 2022 and Forecast 2023 - 2029 by Revenue (USD Million), Y-o-Y Growth (%) and Market Share (%) |
| 12.1.1. Halogen Compounds |
| 12.1.2. Quaternary Ammonium Compounds |
| 12.1.3. Metallic Compounds |
| 12.1.4. Phenolic |
| 12.1.5. Organic Acids |
| 12.1.6. Organosulfur |
| 12.1.7. Others |
| 12.2. Application Analysis 2018 - 2022 and Forecast 2023 - 2029 by Revenue (USD Million), Y-o-Y Growth (%) and Market Share (%) |
| 12.2.1. Water Treatment |
| 12.2.2. Food and Personal Care Products |
| 12.2.3. Cleaning Products |
| 12.2.4. Furniture and Furnishings |
| 12.2.5. Clothing and Textiles |
| 12.2.6. Leather and Suede |
| 12.2.7. Paints and Coatings |
| 12.2.8. Fuel Preservatives |
| 12.2.9. Others |
| 12.3. Country Analysis 2018 - 2022 and Forecast 2023 - 2029 by Revenue (USD Million) Y-o-Y Growth (%) and Market Share (%) |
| 12.3.1. Saudi Arabia |
| 12.3.2. GCC Countries |
| 12.3.3. South Africa |
| 12.3.4. Rest of MEA |
| 12.4. MEA Biocides Market - Opportunity Analysis Index, By Type, Application and Country, 2023 - 2029 |
| 12.5. MEA Biocides Market Dynamics – Trends |
| 13. Competition Landscape |
| 13.1. Strategic Dashboard of Top Market Players |
| 13.2. Company Profiles (Introduction, Financial Analysis, Type Offerings, Key Developments, Strategies, and SWOT Analysis) |
| 13.2.1. Troy Corp. |
| 13.2.2. Chemtreat, Inc. |
| 13.2.3. Neogen Corp. |
| 13.2.4. Finoric LLC |
| 13.2.5. Shanghai Zhongxin Yuxiang Chemicals Co. Ltd. |
| 13.2.6. Iro Group Inc. |
| 13.2.7. Hubei Jinghong Chemicals Co. Ltd. |
| 13.2.8. Wuxi Honor Shine Chemical Co. Ltd. |
| 13.2.9. Albemarle Corporation |
| 13.2.10. Lubrizol |
| 13.2.11. BASF SE |
| 13.2.12. Solvay SA |
| 13.2.13. Lanxess AG |
| 13.2.14. Lonza |
| 14. Research Methodology |
| 15. Key Assumptions and Acronyms |
- Lonza AG
- DuPont
- LANXESS
- Ecolab
- BASF
- Kemira OJY
- Solvay
- Nouryon
- Solenis
- Veolia
