- Refining
- CPI
- Power
- Primary Metals (Steel, Aluminum)
- Pulp & Paper
- Food & Beverages
- Municipal
- General Manufacturing
- Others
Water Treatment Chemicals Market size was valued at 56908.66 Million in 2022 and is estimated to reach 87279.29 Million by 2029, at a CAGR of 6.3% from 2023 to 2029. owing to increasing demand for water treatment chemicals from municipal and manufacturing sectors and increasing surface and underground water pollution coupled with growing demand from the power and industrial applications are the major factors which are anticipated to drive the growth of the market. In addition, government initiatives by making strict regulations to control produced and the waste water disposal are projected to boost the growth of the market. Increasing population and growing urbanization are the main factors that drives the growth of the market. Along with increasing demand for specific formulations and rising demand from various end use industries are expected to fuel the growth of the market. However, availability of various alternative technologies for the water treatment and lack of awareness regarding the chemical water treatment technologies are projected to hamper the growth of the market. Water treatment chemicals are used to treat water and waste water, changing the physical and chemical qualities of water for municipal and industrial use. The demand for water treatment chemicals is increasing as people become more conscious of the importance of clean and safe water, as well as government rules governing waste water treatment.
Global Water Treatment Chemicals Market Summary
Study Period
2024-2030
Base Year
2023
CAGR
6.30%
Largest Market
North America
Fastest Growing Market
Asia Pacific
Water Treatment Chemicals Market Dynamics
The increasing global population and the changes in the climate coupled with the change in energy generation along with the land use and advancements in the water treatment technology are expected to drive the growth of the market. Most of population across the globe depends on the underground water which is not properly treated with chemicals, the demand from such population has seen significant growth over the historic years and is estimated to grow over the forecast years that enhances the growth of the market.
Key Features of the Reports
- Global water treatment chemicals market expanding at significant CAGR over 2023 to 2029 owing to increasing demand from both the developed and developing economies.
- Based on region, North America accounted for larger market revenue share in 2022 and projected gain market revenue share over the forecast period
- Players focusing on innovation of newer products and collaboration strategies to retain market position in global market

Global Water Treatment Chemicals Market Segmentation
By End-user
By Geography
- North America
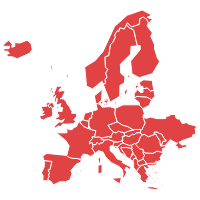
- Europe
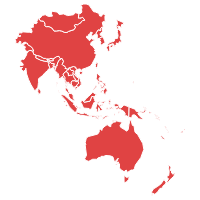
- Asia-Pacific
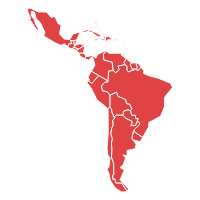
- Latin America
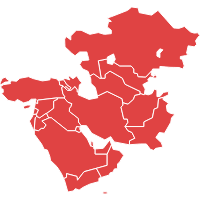
- Middle East and Africa (MEA)
Frequently Asked Questions
The water treatment chemicals market is projected to expand at a CAGR of 6.3% during the forecast period.
AkzoNobel NV, Solvay, Lonza, SNF Group, BASF SE
Asia Pacific is the fastest-growing region for water treatment chemicals market
| 1. Executive Summary |
| 2. Global Water Treatment Chemical Market Introduction |
| 2.1. Global Water Treatment Chemical Market - Taxonomy |
| 2.2. Global Water Treatment Chemical Market -Definitions |
| 2.2.1. By End User Industries |
| 2.2.2. By Region |
| 3. Global Water Treatment Chemical Market Dynamics |
| 3.1. Drivers |
| 3.2. Restraints |
| 3.3. Opportunities/Unmet Needs of the Market |
| 3.4. Trends |
| 3.5. Global Water Treatment Chemical Market Dynamic Factors - Impact Analysis |
| 3.6. Global Water Treatment Chemical Market - Competition Landscape |
| 4. Global Water Treatment Chemical Market Analysis, 2018 - 2022 and Forecast, 2023 - 2029 |
| 4.1. Market Analysis, 2018 - 2022 and Forecast, 2023 - 2029 (Revenue, USD Mn) |
| 4.2. Year-over-Year (Y-o-Y) Growth Analysis (%) |
| 4.3. Market Opportunity Analysis |
| 5. Global Water Treatment Chemical Market, By End User Industries, 2018 - 2022 and Forecast, 2023 - 2029 (Revenue, USD Mn) |
| 5.1. Refining |
| 5.1.1. Cooling |
| 5.1.1.1. Market Analysis, 2018-2022 and Forecast, 2023-2029 (Revenue, USD Mn) |
| 5.1.1.2. Year-over-Year (Y-o-Y) Growth Analysis (%) and Market Share Analysis (%) |
| 5.1.1.3. Market Opportunity Analysis |
| 5.1.2. Boiler |
| 5.1.2.1. Market Analysis, 2018-2022 and Forecast, 2023-2029 (Revenue, USD Mn) |
| 5.1.2.2. Year-over-Year (Y-o-Y) Growth Analysis (%) and Market Share Analysis (%) |
| 5.1.2.3. Market Opportunity Analysis |
| 5.1.3. RO |
| 5.1.3.1. Market Analysis, 2018-2022 and Forecast, 2023-2029 (Revenue, USD Mn) |
| 5.1.3.2. Year-over-Year (Y-o-Y) Growth Analysis (%) and Market Share Analysis (%) |
| 5.1.3.3. Market Opportunity Analysis |
| 5.1.4. Influent |
| 5.1.4.1. Market Analysis, 2018-2022 and Forecast, 2023-2029 (Revenue, USD Mn) |
| 5.1.4.2. Year-over-Year (Y-o-Y) Growth Analysis (%) and Market Share Analysis (%) |
| 5.1.4.3. Market Opportunity Analysis |
| 5.1.5. Waste Water |
| 5.1.5.1. Market Analysis, 2018-2022 and Forecast, 2023-2029 (Revenue, USD Mn) |
| 5.1.5.2. Year-over-Year (Y-o-Y) Growth Analysis (%) and Market Share Analysis (%) |
| 5.1.5.3. Market Opportunity Analysis |
| 5.2. CPI |
| 5.2.1. Cooling |
| 5.2.1.1. Market Analysis, 2018-2022 and Forecast, 2023-2029 (Revenue, USD Mn) |
| 5.2.1.2. Year-over-Year (Y-o-Y) Growth Analysis (%) and Market Share Analysis (%) |
| 5.2.1.3. Market Opportunity Analysis |
| 5.2.2. Boiler |
| 5.2.2.1. Market Analysis, 2018-2022 and Forecast, 2023-2029 (Revenue, USD Mn) |
| 5.2.2.2. Year-over-Year (Y-o-Y) Growth Analysis (%) and Market Share Analysis (%) |
| 5.2.2.3. Market Opportunity Analysis |
| 5.2.3. RO |
| 5.2.3.1. Market Analysis, 2018-2022 and Forecast, 2023-2029 (Revenue, USD Mn) |
| 5.2.3.2. Year-over-Year (Y-o-Y) Growth Analysis (%) and Market Share Analysis (%) |
| 5.2.3.3. Market Opportunity Analysis |
| 5.2.4. Influent |
| 5.2.4.1. Market Analysis, 2018-2022 and Forecast, 2023-2029 (Revenue, USD Mn) |
| 5.2.4.2. Year-over-Year (Y-o-Y) Growth Analysis (%) and Market Share Analysis (%) |
| 5.2.4.3. Market Opportunity Analysis |
| 5.2.5. Waste Water |
| 5.2.5.1. Market Analysis, 2018-2022 and Forecast, 2023-2029 (Revenue, USD Mn) |
| 5.2.5.2. Year-over-Year (Y-o-Y) Growth Analysis (%) and Market Share Analysis (%) |
| 5.2.5.3. Market Opportunity Analysis |
| 5.3. Power |
| 5.3.1. Cooling |
| 5.3.1.1. Market Analysis, 2018-2022 and Forecast, 2023-2029 (Revenue, USD Mn) |
| 5.3.1.2. Year-over-Year (Y-o-Y) Growth Analysis (%) and Market Share Analysis (%) |
| 5.3.1.3. Market Opportunity Analysis |
| 5.3.2. Boiler |
| 5.3.2.1. Market Analysis, 2018-2022 and Forecast, 2023-2029 (Revenue, USD Mn) |
| 5.3.2.2. Year-over-Year (Y-o-Y) Growth Analysis (%) and Market Share Analysis (%) |
| 5.3.2.3. Market Opportunity Analysis |
| 5.3.3. RO |
| 5.3.3.1. Market Analysis, 2018-2022 and Forecast, 2023-2029 (Revenue, USD Mn) |
| 5.3.3.2. Year-over-Year (Y-o-Y) Growth Analysis (%) and Market Share Analysis (%) |
| 5.3.3.3. Market Opportunity Analysis |
| 5.3.4. Influent |
| 5.3.4.1. Market Analysis, 2018-2022 and Forecast, 2023-2029 (Revenue, USD Mn) |
| 5.3.4.2. Year-over-Year (Y-o-Y) Growth Analysis (%) and Market Share Analysis (%) |
| 5.3.4.3. Market Opportunity Analysis |
| 5.3.5. Waste Water |
| 5.3.5.1. Market Analysis, 2018-2022 and Forecast, 2023-2029 (Revenue, USD Mn) |
| 5.3.5.2. Year-over-Year (Y-o-Y) Growth Analysis (%) and Market Share Analysis (%) |
| 5.3.5.3. Market Opportunity Analysis |
| 5.4. Primary Metals (Steel, Aluminum) |
| 5.4.1. Cooling |
| 5.4.1.1. Market Analysis, 2018-2022 and Forecast, 2023-2029 (Revenue, USD Mn) |
| 5.4.1.2. Year-over-Year (Y-o-Y) Growth Analysis (%) and Market Share Analysis (%) |
| 5.4.1.3. Market Opportunity Analysis |
| 5.4.2. Boiler |
| 5.4.2.1. Market Analysis, 2018-2022 and Forecast, 2023-2029 (Revenue, USD Mn) |
| 5.4.2.2. Year-over-Year (Y-o-Y) Growth Analysis (%) and Market Share Analysis (%) |
| 5.4.2.3. Market Opportunity Analysis |
| 5.4.3. RO |
| 5.4.3.1. Market Analysis, 2018-2022 and Forecast, 2023-2029 (Revenue, USD Mn) |
| 5.4.3.2. Year-over-Year (Y-o-Y) Growth Analysis (%) and Market Share Analysis (%) |
| 5.4.3.3. Market Opportunity Analysis |
| 5.4.4. Influent |
| 5.4.4.1. Market Analysis, 2018-2022 and Forecast, 2023-2029 (Revenue, USD Mn) |
| 5.4.4.2. Year-over-Year (Y-o-Y) Growth Analysis (%) and Market Share Analysis (%) |
| 5.4.4.3. Market Opportunity Analysis |
| 5.4.5. Waste Water |
| 5.4.5.1. Market Analysis, 2018-2022 and Forecast, 2023-2029 (Revenue, USD Mn) |
| 5.4.5.2. Year-over-Year (Y-o-Y) Growth Analysis (%) and Market Share Analysis (%) |
| 5.4.5.3. Market Opportunity Analysis |
| 5.5. Pulp & Paper |
| 5.5.1. Cooling |
| 5.5.1.1. Market Analysis, 2018-2022 and Forecast, 2023-2029 (Revenue, USD Mn) |
| 5.5.1.2. Year-over-Year (Y-o-Y) Growth Analysis (%) and Market Share Analysis (%) |
| 5.5.1.3. Market Opportunity Analysis |
| 5.5.2. Boiler |
| 5.5.2.1. Market Analysis, 2018-2022 and Forecast, 2023-2029 (Revenue, USD Mn) |
| 5.5.2.2. Year-over-Year (Y-o-Y) Growth Analysis (%) and Market Share Analysis (%) |
| 5.5.2.3. Market Opportunity Analysis |
| 5.5.3. RO |
| 5.5.3.1. Market Analysis, 2018-2022 and Forecast, 2023-2029 (Revenue, USD Mn) |
| 5.5.3.2. Year-over-Year (Y-o-Y) Growth Analysis (%) and Market Share Analysis (%) |
| 5.5.3.3. Market Opportunity Analysis |
| 5.5.4. Influent |
| 5.5.4.1. Market Analysis, 2018-2022 and Forecast, 2023-2029 (Revenue, USD Mn) |
| 5.5.4.2. Year-over-Year (Y-o-Y) Growth Analysis (%) and Market Share Analysis (%) |
| 5.5.4.3. Market Opportunity Analysis |
| 5.5.5. Waste Water |
| 5.5.5.1. Market Analysis, 2018-2022 and Forecast, 2023-2029 (Revenue, USD Mn) |
| 5.5.5.2. Year-over-Year (Y-o-Y) Growth Analysis (%) and Market Share Analysis (%) |
| 5.5.5.3. Market Opportunity Analysis |
| 5.6. Food & Beverages |
| 5.6.1. Cooling |
| 5.6.1.1. Market Analysis, 2018-2022 and Forecast, 2023-2029 (Revenue, USD Mn) |
| 5.6.1.2. Year-over-Year (Y-o-Y) Growth Analysis (%) and Market Share Analysis (%) |
| 5.6.1.3. Market Opportunity Analysis |
| 5.6.2. Boiler |
| 5.6.2.1. Market Analysis, 2018-2022 and Forecast, 2023-2029 (Revenue, USD Mn) |
| 5.6.2.2. Year-over-Year (Y-o-Y) Growth Analysis (%) and Market Share Analysis (%) |
| 5.6.2.3. Market Opportunity Analysis |
| 5.6.3. RO |
| 5.6.3.1. Market Analysis, 2018-2022 and Forecast, 2023-2029 (Revenue, USD Mn) |
| 5.6.3.2. Year-over-Year (Y-o-Y) Growth Analysis (%) and Market Share Analysis (%) |
| 5.6.3.3. Market Opportunity Analysis |
| 5.6.4. Influent |
| 5.6.4.1. Market Analysis, 2018-2022 and Forecast, 2023-2029 (Revenue, USD Mn) |
| 5.6.4.2. Year-over-Year (Y-o-Y) Growth Analysis (%) and Market Share Analysis (%) |
| 5.6.4.3. Market Opportunity Analysis |
| 5.6.5. Waste Water |
| 5.6.5.1. Market Analysis, 2018-2022 and Forecast, 2023-2029 (Revenue, USD Mn) |
| 5.6.5.2. Year-over-Year (Y-o-Y) Growth Analysis (%) and Market Share Analysis (%) |
| 5.6.5.3. Market Opportunity Analysis |
| 5.7. Municipal |
| 5.7.1. Cooling |
| 5.7.1.1. Market Analysis, 2018-2022 and Forecast, 2023-2029 (Revenue, USD Mn) |
| 5.7.1.2. Year-over-Year (Y-o-Y) Growth Analysis (%) and Market Share Analysis (%) |
| 5.7.1.3. Market Opportunity Analysis |
| 5.7.2. Boiler |
| 5.7.2.1. Market Analysis, 2018-2022 and Forecast, 2023-2029 (Revenue, USD Mn) |
| 5.7.2.2. Year-over-Year (Y-o-Y) Growth Analysis (%) and Market Share Analysis (%) |
| 5.7.2.3. Market Opportunity Analysis |
| 5.7.3. RO |
| 5.7.3.1. Market Analysis, 2018-2022 and Forecast, 2023-2029 (Revenue, USD Mn) |
| 5.7.3.2. Year-over-Year (Y-o-Y) Growth Analysis (%) and Market Share Analysis (%) |
| 5.7.3.3. Market Opportunity Analysis |
| 5.7.4. Influent |
| 5.7.4.1. Market Analysis, 2018-2022 and Forecast, 2023-2029 (Revenue, USD Mn) |
| 5.7.4.2. Year-over-Year (Y-o-Y) Growth Analysis (%) and Market Share Analysis (%) |
| 5.7.4.3. Market Opportunity Analysis |
| 5.7.5. Waste Water |
| 5.7.5.1. Market Analysis, 2018-2022 and Forecast, 2023-2029 (Revenue, USD Mn) |
| 5.7.5.2. Year-over-Year (Y-o-Y) Growth Analysis (%) and Market Share Analysis (%) |
| 5.7.5.3. Market Opportunity Analysis |
| 5.8. General Manufacturing |
| 5.8.1. Cooling |
| 5.8.1.1. Market Analysis, 2018-2022 and Forecast, 2023-2029 (Revenue, USD Mn) |
| 5.8.1.2. Year-over-Year (Y-o-Y) Growth Analysis (%) and Market Share Analysis (%) |
| 5.8.1.3. Market Opportunity Analysis |
| 5.8.2. Boiler |
| 5.8.2.1. Market Analysis, 2018-2022 and Forecast, 2023-2029 (Revenue, USD Mn) |
| 5.8.2.2. Year-over-Year (Y-o-Y) Growth Analysis (%) and Market Share Analysis (%) |
| 5.8.2.3. Market Opportunity Analysis |
| 5.8.3. RO |
| 5.8.3.1. Market Analysis, 2018-2022 and Forecast, 2023-2029 (Revenue, USD Mn) |
| 5.8.3.2. Year-over-Year (Y-o-Y) Growth Analysis (%) and Market Share Analysis (%) |
| 5.8.3.3. Market Opportunity Analysis |
| 5.8.4. Influent |
| 5.8.4.1. Market Analysis, 2018-2022 and Forecast, 2023-2029 (Revenue, USD Mn) |
| 5.8.4.2. Year-over-Year (Y-o-Y) Growth Analysis (%) and Market Share Analysis (%) |
| 5.8.4.3. Market Opportunity Analysis |
| 5.8.5. Waste Water |
| 5.8.5.1. Market Analysis, 2018-2022 and Forecast, 2023-2029 (Revenue, USD Mn) |
| 5.8.5.2. Year-over-Year (Y-o-Y) Growth Analysis (%) and Market Share Analysis (%) |
| 5.8.5.3. Market Opportunity Analysis |
| 5.9. Others |
| 5.9.1. Cooling |
| 5.9.1.1. Market Analysis, 2018-2022 and Forecast, 2023-2029 (Revenue, USD Mn) |
| 5.9.1.2. Year-over-Year (Y-o-Y) Growth Analysis (%) and Market Share Analysis (%) |
| 5.9.1.3. Market Opportunity Analysis |
| 5.9.2. Boiler |
| 5.9.2.1. Market Analysis, 2018-2022 and Forecast, 2023-2029 (Revenue, USD Mn) |
| 5.9.2.2. Year-over-Year (Y-o-Y) Growth Analysis (%) and Market Share Analysis (%) |
| 5.9.2.3. Market Opportunity Analysis |
| 5.9.3. RO |
| 5.9.3.1. Market Analysis, 2018-2022 and Forecast, 2023-2029 (Revenue, USD Mn) |
| 5.9.3.2. Year-over-Year (Y-o-Y) Growth Analysis (%) and Market Share Analysis (%) |
| 5.9.3.3. Market Opportunity Analysis |
| 5.9.4. Influent |
| 5.9.4.1. Market Analysis, 2018-2022 and Forecast, 2023-2029 (Revenue, USD Mn) |
| 5.9.4.2. Year-over-Year (Y-o-Y) Growth Analysis (%) and Market Share Analysis (%) |
| 5.9.4.3. Market Opportunity Analysis |
| 5.9.5. Waste Water |
| 5.9.5.1. Market Analysis, 2018-2022 and Forecast, 2023-2029 (Revenue, USD Mn) |
| 5.9.5.2. Year-over-Year (Y-o-Y) Growth Analysis (%) and Market Share Analysis (%) |
| 5.9.5.3. Market Opportunity Analysis |
| 6. Global Water Treatment Chemical Market Forecast, By Region, 2018 - 2022 and Forecast, 2023 - 2029 (Revenue, USD Mn) |
| 6.1. North America |
| 6.1.1. Market Analysis, 2018 - 2022 and Forecast, 2023 - 2029 (Revenue, USD Mn) |
| 6.1.2. Year-over-Year (Y-o-Y) Growth Analysis (%) and Market Share Analysis (%) |
| 6.1.3. Market Opportunity Analysis |
| 6.2. Europe |
| 6.2.1. Market Analysis, 2018 - 2022 and Forecast, 2023 - 2029 (Revenue, USD Mn) |
| 6.2.2. Year-over-Year (Y-o-Y) Growth Analysis (%) and Market Share Analysis (%) |
| 6.2.3. Market Opportunity Analysis |
| 6.3. Asia-Pacific |
| 6.3.1. Market Analysis, 2018 - 2022 and Forecast, 2023 - 2029 (Revenue, USD Mn) |
| 6.3.2. Year-over-Year (Y-o-Y) Growth Analysis (%) and Market Share Analysis (%) |
| 6.3.3. Market Opportunity Analysis |
| 6.4. Latin America |
| 6.4.1. Market Analysis, 2018 - 2022 and Forecast, 2023 - 2029 (Revenue, USD Mn) |
| 6.4.2. Year-over-Year (Y-o-Y) Growth Analysis (%) and Market Share Analysis (%) |
| 6.4.3. Market Opportunity Analysis |
| 6.5. Middle East and Africa |
| 6.5.1. Market Analysis, 2018 - 2022 and Forecast, 2023 - 2029 (Revenue, USD Mn) |
| 6.5.2. Year-over-Year (Y-o-Y) Growth Analysis (%) and Market Share Analysis (%) |
| 6.5.3. Market Opportunity Analysis |
| 6.6. Global Water Treatment Chemical Market - Opportunity Analysis Index, By End User Industries, and Region, 2023 - 2029 |
| 7. North America Water Treatment Chemical Market Analysis, 2018 - 2022 and Forecast, 2023 - 2029 (Revenue, USD Mn) |
| 7.1. End User Industries Analysis 2018 - 2022 and Forecast 2023 - 2029 by Revenue (USD Mn), Y-o-Y Growth (%), and Market Share (%) |
| 7.1.1. Refining |
| 7.1.1.1. Cooling |
| 7.1.1.2. Boiler |
| 7.1.1.3. RO |
| 7.1.1.4. Influent |
| 7.1.1.5. Waste Water |
| 7.1.2. CPI |
| 7.1.2.1. Cooling |
| 7.1.2.2. Boiler |
| 7.1.2.3. RO |
| 7.1.2.4. Influent |
| 7.1.2.5. Waste Water |
| 7.1.3. Power |
| 7.1.3.1. Cooling |
| 7.1.3.2. Boiler |
| 7.1.3.3. RO |
| 7.1.3.4. Influent |
| 7.1.3.5. Waste Water |
| 7.1.4. Primary Metals (Steel, Aluminum) |
| 7.1.4.1. Cooling |
| 7.1.4.2. Boiler |
| 7.1.4.3. RO |
| 7.1.4.4. Influent |
| 7.1.4.5. Waste Water |
| 7.1.5. Pulp & Paper |
| 7.1.5.1. Cooling |
| 7.1.5.2. Boiler |
| 7.1.5.3. RO |
| 7.1.5.4. Influent |
| 7.1.5.5. Waste Water |
| 7.1.6. Food & Beverages |
| 7.1.6.1. Cooling |
| 7.1.6.2. Boiler |
| 7.1.6.3. RO |
| 7.1.6.4. Influent |
| 7.1.6.5. Waste Water |
| 7.1.7. Municipal |
| 7.1.7.1. Cooling |
| 7.1.7.2. Boiler |
| 7.1.7.3. RO |
| 7.1.7.4. Influent |
| 7.1.7.5. Waste Water |
| 7.1.8. General Manufacturing |
| 7.1.8.1. Cooling |
| 7.1.8.2. Boiler |
| 7.1.8.3. RO |
| 7.1.8.4. Influent |
| 7.1.8.5. Waste Water |
| 7.1.9. Others |
| 7.1.9.1. Cooling |
| 7.1.9.2. Boiler |
| 7.1.9.3. RO |
| 7.1.9.4. Influent |
| 7.1.9.5. Waste Water |
| 7.2. Country Analysis 2018 - 2022 and Forecast 2023 - 2029 by Revenue (USD Mn) Y-o-Y Growth (%) and Market Share (%) |
| 7.2.1. USA |
| 7.2.2. Canada |
| 7.3. North America Water Treatment Chemical Market - Opportunity Analysis Index, By End User Industries, and Country, 2023 - 2029 |
| 7.4. North America Water Treatment Chemical Market Dynamics - Trends |
| 8. Europe Water Treatment Chemical Market Analysis, 2018 - 2022 and Forecast, 2023 - 2029 (Revenue, USD Mn) |
| 8.1. End User Industries Analysis 2018 - 2022 and Forecast 2023 - 2029 by Revenue (USD Mn), Y-o-Y Growth (%), and Market Share (%) |
| 8.1.1. Refining |
| 8.1.1.1. Cooling |
| 8.1.1.2. Boiler |
| 8.1.1.3. RO |
| 8.1.1.4. Influent |
| 8.1.1.5. Waste Water |
| 8.1.2. CPI |
| 8.1.2.1. Cooling |
| 8.1.2.2. Boiler |
| 8.1.2.3. RO |
| 8.1.2.4. Influent |
| 8.1.2.5. Waste Water |
| 8.1.3. Power |
| 8.1.3.1. Cooling |
| 8.1.3.2. Boiler |
| 8.1.3.3. RO |
| 8.1.3.4. Influent |
| 8.1.3.5. Waste Water |
| 8.1.4. Primary Metals (Steel, Aluminum) |
| 8.1.4.1. Cooling |
| 8.1.4.2. Boiler |
| 8.1.4.3. RO |
| 8.1.4.4. Influent |
| 8.1.4.5. Waste Water |
| 8.1.5. Pulp & Paper |
| 8.1.5.1. Cooling |
| 8.1.5.2. Boiler |
| 8.1.5.3. RO |
| 8.1.5.4. Influent |
| 8.1.5.5. Waste Water |
| 8.1.6. Food & Beverages |
| 8.1.6.1. Cooling |
| 8.1.6.2. Boiler |
| 8.1.6.3. RO |
| 8.1.6.4. Influent |
| 8.1.6.5. Waste Water |
| 8.1.7. Municipal |
| 8.1.7.1. Cooling |
| 8.1.7.2. Boiler |
| 8.1.7.3. RO |
| 8.1.7.4. Influent |
| 8.1.7.5. Waste Water |
| 8.1.8. General Manufacturing |
| 8.1.8.1. Cooling |
| 8.1.8.2. Boiler |
| 8.1.8.3. RO |
| 8.1.8.4. Influent |
| 8.1.8.5. Waste Water |
| 8.1.9. Others |
| 8.1.9.1. Cooling |
| 8.1.9.2. Boiler |
| 8.1.9.3. RO |
| 8.1.9.4. Influent |
| 8.1.9.5. Waste Water |
| 8.2. Country Analysis 2018 - 2022 and Forecast 2023 - 2029 by Revenue (USD Mn) Y-o-Y Growth (%) and Market Share (%) |
| 8.2.1. Germany |
| 8.2.2. UK |
| 8.2.3. France |
| 8.2.4. Spain |
| 8.2.5. Italy |
| 8.2.6. Russia |
| 8.2.7. Rest of Europe |
| 8.3. Europe Water Treatment Chemical Market - Opportunity Analysis Index, By End User Industries, and Country, 2023 - 2029 |
| 8.4. Europe Water Treatment Chemical Market Dynamics - Trends |
| 9. Asia-Pacific Water Treatment Chemical Market Analysis, 2018 - 2022 and Forecast, 2023 - 2029 (Revenue, USD Mn) |
| 9.1. End User Industries Analysis 2018 - 2022 and Forecast 2023 - 2029 by Revenue (USD Mn), Y-o-Y Growth (%), and Market Share (%) |
| 9.1.1. Refining |
| 9.1.1.1. Cooling |
| 9.1.1.2. Boiler |
| 9.1.1.3. RO |
| 9.1.1.4. Influent |
| 9.1.1.5. Waste Water |
| 9.1.2. CPI |
| 9.1.2.1. Cooling |
| 9.1.2.2. Boiler |
| 9.1.2.3. RO |
| 9.1.2.4. Influent |
| 9.1.2.5. Waste Water |
| 9.1.3. Power |
| 9.1.3.1. Cooling |
| 9.1.3.2. Boiler |
| 9.1.3.3. RO |
| 9.1.3.4. Influent |
| 9.1.3.5. Waste Water |
| 9.1.4. Primary Metals (Steel, Aluminum) |
| 9.1.4.1. Cooling |
| 9.1.4.2. Boiler |
| 9.1.4.3. RO |
| 9.1.4.4. Influent |
| 9.1.4.5. Waste Water |
| 9.1.5. Pulp & Paper |
| 9.1.5.1. Cooling |
| 9.1.5.2. Boiler |
| 9.1.5.3. RO |
| 9.1.5.4. Influent |
| 9.1.5.5. Waste Water |
| 9.1.6. Food & Beverages |
| 9.1.6.1. Cooling |
| 9.1.6.2. Boiler |
| 9.1.6.3. RO |
| 9.1.6.4. Influent |
| 9.1.6.5. Waste Water |
| 9.1.7. Municipal |
| 9.1.7.1. Cooling |
| 9.1.7.2. Boiler |
| 9.1.7.3. RO |
| 9.1.7.4. Influent |
| 9.1.7.5. Waste Water |
| 9.1.8. General Manufacturing |
| 9.1.8.1. Cooling |
| 9.1.8.2. Boiler |
| 9.1.8.3. RO |
| 9.1.8.4. Influent |
| 9.1.8.5. Waste Water |
| 9.1.9. Others |
| 9.1.9.1. Cooling |
| 9.1.9.2. Boiler |
| 9.1.9.3. RO |
| 9.1.9.4. Influent |
| 9.1.9.5. Waste Water |
| 9.2. Country Analysis 2018 - 2022 and Forecast 2023 - 2029 by Revenue (USD Mn) Y-o-Y Growth (%) and Market Share (%) |
| 9.2.1. China |
| 9.2.2. India |
| 9.2.3. Japan |
| 9.2.4. ASEAN |
| 9.2.5. Australia & New Zealand |
| 9.2.6. Rest of Asia-Pacific |
| 9.3. Asia-Pacific Water Treatment Chemical Market - Opportunity Analysis Index, By End User Industries and Country, 2023 - 2029 |
| 9.4. Asia-Pacific Water Treatment Chemical Market Dynamics - Trends |
| 10. Latin America Water Treatment Chemical Market Analysis, 2018 - 2022 and Forecast, 2023 - 2029 (Revenue, USD Mn) |
| 10.1. End User Industries Analysis 2018 - 2022 and Forecast 2023 - 2029 by Revenue (USD Mn), Y-o-Y Growth (%), and Market Share (%) |
| 10.1.1. Refining |
| 10.1.1.1. Cooling |
| 10.1.1.2. Boiler |
| 10.1.1.3. RO |
| 10.1.1.4. Influent |
| 10.1.1.5. Waste Water |
| 10.1.2. CPI |
| 10.1.2.1. Cooling |
| 10.1.2.2. Boiler |
| 10.1.2.3. RO |
| 10.1.2.4. Influent |
| 10.1.2.5. Waste Water |
| 10.1.3. Power |
| 10.1.3.1. Cooling |
| 10.1.3.2. Boiler |
| 10.1.3.3. RO |
| 10.1.3.4. Influent |
| 10.1.3.5. Waste Water |
| 10.1.4. Primary Metals (Steel, Aluminum) |
| 10.1.4.1. Cooling |
| 10.1.4.2. Boiler |
| 10.1.4.3. RO |
| 10.1.4.4. Influent |
| 10.1.4.5. Waste Water |
| 10.1.5. Pulp & Paper |
| 10.1.5.1. Cooling |
| 10.1.5.2. Boiler |
| 10.1.5.3. RO |
| 10.1.5.4. Influent |
| 10.1.5.5. Waste Water |
| 10.1.6. Food & Beverages |
| 10.1.6.1. Cooling |
| 10.1.6.2. Boiler |
| 10.1.6.3. RO |
| 10.1.6.4. Influent |
| 10.1.6.5. Waste Water |
| 10.1.7. Municipal |
| 10.1.7.1. Cooling |
| 10.1.7.2. Boiler |
| 10.1.7.3. RO |
| 10.1.7.4. Influent |
| 10.1.7.5. Waste Water |
| 10.1.8. General Manufacturing |
| 10.1.8.1. Cooling |
| 10.1.8.2. Boiler |
| 10.1.8.3. RO |
| 10.1.8.4. Influent |
| 10.1.8.5. Waste Water |
| 10.1.9. Others |
| 10.1.9.1. Cooling |
| 10.1.9.2. Boiler |
| 10.1.9.3. RO |
| 10.1.9.4. Influent |
| 10.1.9.5. Waste Water |
| 10.2. Country Analysis 2018 - 2022 and Forecast 2023 - 2029 by Revenue (USD Mn) Y-o-Y Growth (%) and Market Share (%) |
| 10.2.1. Brazil |
| 10.2.2. Mexico |
| 10.2.3. Argentina |
| 10.2.4. Rest of Latin America |
| 10.3. Latin America Water Treatment Chemical Market - Opportunity Analysis Index, By End User Industries and Country, 2023 - 2029 |
| 10.4. Latin America Water Treatment Chemical Market Dynamics - Trends |
| 11. Middle East and Africa Water Treatment Chemical Market Analysis, 2018 - 2022 and Forecast, 2023 - 2029 (Revenue, USD Mn) |
| 11.1. End User Industries Analysis 2018 - 2022 and Forecast 2023 - 2029 by Revenue (USD Mn), Y-o-Y Growth (%), and Market Share (%) |
| 11.1.1. Refining |
| 11.1.1.1. Cooling |
| 11.1.1.2. Boiler |
| 11.1.1.3. RO |
| 11.1.1.4. Influent |
| 11.1.1.5. Waste Water |
| 11.1.2. CPI |
| 11.1.2.1. Cooling |
| 11.1.2.2. Boiler |
| 11.1.2.3. RO |
| 11.1.2.4. Influent |
| 11.1.2.5. Waste Water |
| 11.1.3. Power |
| 11.1.3.1. Cooling |
| 11.1.3.2. Boiler |
| 11.1.3.3. RO |
| 11.1.3.4. Influent |
| 11.1.3.5. Waste Water |
| 11.1.4. Primary Metals (Steel, Aluminum) |
| 11.1.4.1. Cooling |
| 11.1.4.2. Boiler |
| 11.1.4.3. RO |
| 11.1.4.4. Influent |
| 11.1.4.5. Waste Water |
| 11.1.5. Pulp & Paper |
| 11.1.5.1. Cooling |
| 11.1.5.2. Boiler |
| 11.1.5.3. RO |
| 11.1.5.4. Influent |
| 11.1.5.5. Waste Water |
| 11.1.6. Food & Beverages |
| 11.1.6.1. Cooling |
| 11.1.6.2. Boiler |
| 11.1.6.3. RO |
| 11.1.6.4. Influent |
| 11.1.6.5. Waste Water |
| 11.1.7. Municipal |
| 11.1.7.1. Cooling |
| 11.1.7.2. Boiler |
| 11.1.7.3. RO |
| 11.1.7.4. Influent |
| 11.1.7.5. Waste Water |
| 11.1.8. General Manufacturing |
| 11.1.8.1. Cooling |
| 11.1.8.2. Boiler |
| 11.1.8.3. RO |
| 11.1.8.4. Influent |
| 11.1.8.5. Waste Water |
| 11.1.9. Others |
| 11.1.9.1. Cooling |
| 11.1.9.2. Boiler |
| 11.1.9.3. RO |
| 11.1.9.4. Influent |
| 11.1.9.5. Waste Water |
| 11.2. Country Analysis 2018 - 2022 and Forecast 2023 - 2029 by Revenue (USD Mn) Y-o-Y Growth (%) and Market Share (%) |
| 11.2.1. Gulf Cooperation Council (GCC) Countries |
| 11.2.2. Israel |
| 11.2.3. South Africa |
| 11.2.4. Rest of MEA |
| 11.3. MEA Water Treatment Chemical Market - Opportunity Analysis Index, By End User Industries and Country, 2023 - 2029 |
| 11.4. MEA Water Treatment Chemical Market Dynamics - Trends |
| 12. Competition Landscape |
| 12.1. Strategic Dashboard of Top Market Players |
| 12.2. Company Profiles (Introduction, Financial Analysis, Offerings, Key Developments, Strategies, and SWOT Analysis) |
| 12.2.1. Akzo Nobel N.V. |
| 12.2.2. Baker Hughes Company |
| 12.2.3. BASF SE |
| 12.2.4. Ecolab |
| 12.2.5. Kemira Oyj |
| 12.2.6. Lonza Group Ag |
| 12.2.7. SNF Floerger |
| 12.2.8. Solenis International Llc |
| 12.2.9. Suez SA |
| 12.2.10. The Dow Chemical Company |
| 13. Research Methodology |
| 14. Key Assumptions and Acronyms |
- Akzo Nobel N.V.
- Baker Hughes Company
- BASF SE
- Ecolab
- Kemira Oyj
- Lonza Group Ag
- SNF Floerger
- Solenis International Llc
- Suez SA
- The Dow Chemical Company
