- Documentation
- Medical Equipment
- Medical Delivery
- Telehealth
- Others
Medical Computer Carts Market size valued at USD 204.57 million in 2022 and expected to reach USD 493.86 million by 2028, registering at a significant CAGR of 16.3% from 2023-2029. Medical computer cart devices are designed to reduce the workload on healthcare professionals and enhance the patient care. Medical computer carts are used in healthcare for various applications such as medical recording, training, charting, nursing education and also medicine dispensing. Medical computer carts range from small and portable carts used in small clinics to the fully featured medical computer carts used for simplification of many complicated processes. Companies are adapting mergers and acquisitions for boosting their market share. The medical computer carts market have grown in popularity over the years as a result of their numerous uses in disciplines such as medical documentation, training, charting, nursing education, and pharmaceutical distribution. Furthermore, concentrating on the customization and incorporating new and innovative features for the devices and place them as unique in the market. For instance, in July 2014, Caspa Solutions LLC, a leading provider of medical management systems acquired Kirby Lester, a provider of automated medication dispensing solutions for various segments of healthcare. By this acquisition, Capsa Solutions expanded its product portfolio. Similarly, in June 2016, TouchPoint Medical acquired healthcare technology business of InterMetro Industries, that includes medical dispensing carts, access center and medispense automated dispensing machines, and metromount wall mounting systems.
Medical Computer Carts Market Key Developments :
- In April 2020, Midwest Products & Engineering (MPE-INC) (U.S.) launched an emergency response cart to solve ventilator workflow issues related to the urgent treatment of COVID-19 patients.
- In August 2021, Capsa Healthcare has aquired Specialty Carts, Inc., a healthcare cart manufacturer based in St. Louis, MO. Capsas purchase of Specialty Carts is the companys sixth major brand acquisition in the last 11 years.
Medical Computer Carts Market Summary
Study Period
2024-2030
Base Year
2023
CAGR
16.3%
Largest Market
North America
Fastest Growing Market
Europe
Medical Computer Carts Market Dynamics
The market is expected to grow at significant rates owing to the adaptation of digital technologies in simplifying the medical processes in hospitals and healthcare centers. Furthermore, the emergence of electronic medical record system (EMR) which involves collecting, store and displaying of patients medical health statistics that require equipment for maintaining the workflow are expected to boost the market during the forecast period. In addition, availability of portable medical computer carts and improvements in features are expected to bolster the medical computer carts market over the forecast period. However, lack of awareness among the medical staff and the high cost of devices are expected to hamper the market over the forecast period.
Key Features of the Reports
- The report provides granular level information about the market size, regional market share, historic market (2019-2023), and forecast (2024-2030)
- The report covers in-detail insights about the competitor's overview, company share analysis, key market developments, and their key strategies
- The report outlines drivers, restraints, unmet needs, and trends that are currently affecting the market
- The report tracks recent innovations, key developments, and start-up details that are actively working in the market
- The report provides a plethora of information about market entry strategies, regulatory framework, and reimbursement scenario

Medical Computer Carts Market Segmentation
By Application
By Monitor
- Single Monitor
- Double Monitor
- Laptop
- Tablet
By End User
- Hospitals
- Diagnostic Centers
- Others
By Geography
- North America
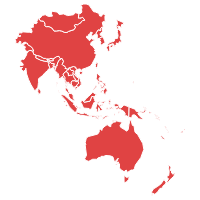
- Asia Pacific
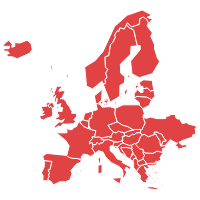
- Europe
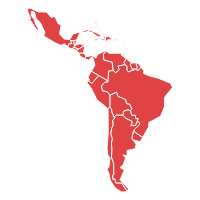
- Latin America
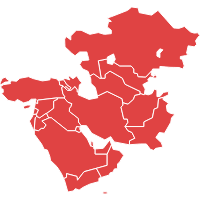
- Middle East and Africa,
Frequently Asked Questions
The Medical computer carts market size was valued at USD 204.57 million in 2022
The key segments covered in the medical computer carts market are technology, components, application, and end-users.
The Medical computer carts market key players are Capsa Solutions LLC (U.S.), Ergotron, Inc. (Melrose Industries plc) (UK), Enovate Medical (U.S.), Villard (France), Parity Medical (UK), InterMetro Industries Corp. (Emerson Electric) (U.S.), Humanscale Healthcare (U.S.), ITD GmBH (Germany), Compucaddy (U.S.), Advantech Co., Ltd. (China), Bytech Healthcare Ltd. (U.K.)
| 1.Executive Summary |
| 2.Global Medical Computer Carts Market Introduction |
| 2.1.Global Medical Computer Carts Market - Taxonomy |
| 2.2.Global Medical Computer Carts Market - Definitions |
| 2.2.1.Application |
| 2.2.2.Monitor |
| 2.2.3.End User |
| 2.2.4.Region |
| 3.Global Medical Computer Carts Market Dynamics |
| 3.1. Drivers |
| 3.2. Restraints |
| 3.3. Opportunities/Unmet Needs of the Market |
| 3.4. Trends |
| 3.5. Product Landscape |
| 3.6. New Product Launches |
| 3.7. Impact of COVID 19 on Market |
| 4.Global Medical Computer Carts Market Analysis, 2018 - 2022 and Forecast 2023 - 2029 |
| 4.1. Market Analysis, 2018 - 2022 and Forecast, 2023 - 2029, (Sales Value USD Million) |
| 4.2. Year-Over-Year (Y-o-Y) Growth Analysis (%) |
| 4.3. Market Opportunity Analysis |
| 5.Global Medical Computer Carts Market By Application, 2018 - 2022 and Forecast 2023 - 2029 (Sales Value USD Million) |
| 5.1. Documentation |
| 5.1.1. Market Analysis, 2018 - 2022 and Forecast, 2023 - 2029, (Sales Value USD Million) |
| 5.1.2. Year-Over-Year (Y-o-Y) Growth Analysis (%) and Market Share Analysis (%) |
| 5.1.3. Market Opportunity Analysis |
| 5.2. Medical Equipment |
| 5.2.1. Market Analysis, 2018 - 2022 and Forecast, 2023 - 2029, (Sales Value USD Million) |
| 5.2.2. Year-Over-Year (Y-o-Y) Growth Analysis (%) and Market Share Analysis (%) |
| 5.2.3. Market Opportunity Analysis |
| 5.3. Medical Delivery |
| 5.3.1. Market Analysis, 2018 - 2022 and Forecast, 2023 - 2029, (Sales Value USD Million) |
| 5.3.2. Year-Over-Year (Y-o-Y) Growth Analysis (%) and Market Share Analysis (%) |
| 5.3.3. Market Opportunity Analysis |
| 5.4. Telehealth |
| 5.4.1. Market Analysis, 2018 - 2022 and Forecast, 2023 - 2029, (Sales Value USD Million) |
| 5.4.2. Year-Over-Year (Y-o-Y) Growth Analysis (%) and Market Share Analysis (%) |
| 5.4.3. Market Opportunity Analysis |
| 5.5. Others |
| 5.5.1. Market Analysis, 2018 - 2022 and Forecast, 2023 - 2029, (Sales Value USD Million) |
| 5.5.2. Year-Over-Year (Y-o-Y) Growth Analysis (%) and Market Share Analysis (%) |
| 5.5.3. Market Opportunity Analysis |
| 6.Global Medical Computer Carts Market By Monitor, 2018 - 2022 and Forecast 2023 - 2029 (Sales Value USD Million) |
| 6.1. Single Monitor |
| 6.1.1. Market Analysis, 2018 - 2022 and Forecast, 2023 - 2029, (Sales Value USD Million) |
| 6.1.2. Year-Over-Year (Y-o-Y) Growth Analysis (%) and Market Share Analysis (%) |
| 6.1.3. Market Opportunity Analysis |
| 6.2. Double Monitor |
| 6.2.1. Market Analysis, 2018 - 2022 and Forecast, 2023 - 2029, (Sales Value USD Million) |
| 6.2.2. Year-Over-Year (Y-o-Y) Growth Analysis (%) and Market Share Analysis (%) |
| 6.2.3. Market Opportunity Analysis |
| 6.3. Laptop |
| 6.3.1. Market Analysis, 2018 - 2022 and Forecast, 2023 - 2029, (Sales Value USD Million) |
| 6.3.2. Year-Over-Year (Y-o-Y) Growth Analysis (%) and Market Share Analysis (%) |
| 6.3.3. Market Opportunity Analysis |
| 6.4. Tablet |
| 6.4.1. Market Analysis, 2018 - 2022 and Forecast, 2023 - 2029, (Sales Value USD Million) |
| 6.4.2. Year-Over-Year (Y-o-Y) Growth Analysis (%) and Market Share Analysis (%) |
| 6.4.3. Market Opportunity Analysis |
| 7.Global Medical Computer Carts Market By End User, 2018 - 2022 and Forecast 2023 - 2029 (Sales Value USD Million) |
| 7.1. Hospitals |
| 7.1.1. Market Analysis, 2018 - 2022 and Forecast, 2023 - 2029, (Sales Value USD Million) |
| 7.1.2. Year-Over-Year (Y-o-Y) Growth Analysis (%) and Market Share Analysis (%) |
| 7.1.3. Market Opportunity Analysis |
| 7.2. Diagnostic Centers |
| 7.2.1. Market Analysis, 2018 - 2022 and Forecast, 2023 - 2029, (Sales Value USD Million) |
| 7.2.2. Year-Over-Year (Y-o-Y) Growth Analysis (%) and Market Share Analysis (%) |
| 7.2.3. Market Opportunity Analysis |
| 7.3. Others |
| 7.3.1. Market Analysis, 2018 - 2022 and Forecast, 2023 - 2029, (Sales Value USD Million) |
| 7.3.2. Year-Over-Year (Y-o-Y) Growth Analysis (%) and Market Share Analysis (%) |
| 7.3.3. Market Opportunity Analysis |
| 8.Global Medical Computer Carts Market By Region, 2018 - 2022 and Forecast 2023 - 2029 (Sales Value USD Million) |
| 8.1. North America |
| 8.1.1. Market Analysis, 2018 - 2022 and Forecast, 2023 - 2029, (Sales Value USD Million) |
| 8.1.2. Year-Over-Year (Y-o-Y) Growth Analysis (%) and Market Share Analysis (%) |
| 8.1.3. Market Opportunity Analysis |
| 8.2. Europe |
| 8.2.1. Market Analysis, 2018 - 2022 and Forecast, 2023 - 2029, (Sales Value USD Million) |
| 8.2.2. Year-Over-Year (Y-o-Y) Growth Analysis (%) and Market Share Analysis (%) |
| 8.2.3. Market Opportunity Analysis |
| 8.3. Asia Pacific (APAC) |
| 8.3.1. Market Analysis, 2018 - 2022 and Forecast, 2023 - 2029, (Sales Value USD Million) |
| 8.3.2. Year-Over-Year (Y-o-Y) Growth Analysis (%) and Market Share Analysis (%) |
| 8.3.3. Market Opportunity Analysis |
| 8.4. Middle East and Africa (MEA) |
| 8.4.1. Market Analysis, 2018 - 2022 and Forecast, 2023 - 2029, (Sales Value USD Million) |
| 8.4.2. Year-Over-Year (Y-o-Y) Growth Analysis (%) and Market Share Analysis (%) |
| 8.4.3. Market Opportunity Analysis |
| 8.5. Latin America |
| 8.5.1. Market Analysis, 2018 - 2022 and Forecast, 2023 - 2029, (Sales Value USD Million) |
| 8.5.2. Year-Over-Year (Y-o-Y) Growth Analysis (%) and Market Share Analysis (%) |
| 8.5.3. Market Opportunity Analysis |
| 9.North America Medical Computer Carts Market ,2018 - 2022 and Forecast 2023 - 2029 (Sales Value USD Million) |
| 9.1. Application Analysis 2018 - 2022 and Forecast 2023 - 2029 by Sales Value USD Million, Y-o-Y Growth (%), and Market Share (%) |
| 9.1.1.Documentation |
| 9.1.2.Medical Equipment |
| 9.1.3.Medical Delivery |
| 9.1.4.Telehealth |
| 9.1.5.Others |
| 9.2. Monitor Analysis 2018 - 2022 and Forecast 2023 - 2029 by Sales Value USD Million, Y-o-Y Growth (%), and Market Share (%) |
| 9.2.1.Single Monitor |
| 9.2.2.Double Monitor |
| 9.2.3.Laptop |
| 9.2.4.Tablet |
| 9.3. End User Analysis 2018 - 2022 and Forecast 2023 - 2029 by Sales Value USD Million, Y-o-Y Growth (%), and Market Share (%) |
| 9.3.1.Hospitals |
| 9.3.2.Diagnostic Centers |
| 9.3.3.Others |
| 9.4. Country Analysis 2018 - 2022 and Forecast 2023 - 2029 by Sales Value USD Million, Y-o-Y Growth (%), and Market Share (%) |
| 9.4.1.United States of America (USA) |
| 9.4.2.Canada |
| 10.Europe Medical Computer Carts Market ,2018 - 2022 and Forecast 2023 - 2029 (Sales Value USD Million) |
| 10.1. Application Analysis and Forecast by Sales Value USD Million, Y-o-Y Growth (%), and Market Share (%) |
| 10.1.1.Documentation |
| 10.1.2.Medical Equipment |
| 10.1.3.Medical Delivery |
| 10.1.4.Telehealth |
| 10.1.5.Others |
| 10.2. Monitor Analysis 2018 - 2022 and Forecast 2023 - 2029 by Sales Value USD Million, Y-o-Y Growth (%), and Market Share (%) |
| 10.2.1.Single Monitor |
| 10.2.2.Double Monitor |
| 10.2.3.Laptop |
| 10.2.4.Tablet |
| 10.3. End User Analysis 2018 - 2022 and Forecast 2023 - 2029 by Sales Value USD Million, Y-o-Y Growth (%), and Market Share (%) |
| 10.3.1.Hospitals |
| 10.3.2.Diagnostic Centers |
| 10.3.3.Others |
| 10.4. Country Analysis 2018 - 2022 and Forecast 2023 - 2029 by Sales Value USD Million, Y-o-Y Growth (%), and Market Share (%) |
| 10.4.1.Germany |
| 10.4.2.France |
| 10.4.3.Italy |
| 10.4.4.United Kingdom (UK) |
| 10.4.5.Spain |
| 10.4.6.Rest of EU |
| 11.Asia Pacific (APAC) Medical Computer Carts Market ,2018 - 2022 and Forecast 2023 - 2029 (Sales Value USD Million) |
| 11.1. Application Analysis and Forecast by Sales Value USD Million, Y-o-Y Growth (%), and Market Share (%) |
| 11.1.1.Documentation |
| 11.1.2.Medical Equipment |
| 11.1.3.Medical Delivery |
| 11.1.4.Telehealth |
| 11.1.5.Others |
| 11.2. Monitor Analysis 2018 - 2022 and Forecast 2023 - 2029 by Sales Value USD Million, Y-o-Y Growth (%), and Market Share (%) |
| 11.2.1.Single Monitor |
| 11.2.2.Double Monitor |
| 11.2.3.Laptop |
| 11.2.4.Tablet |
| 11.3. End User Analysis 2018 - 2022 and Forecast 2023 - 2029 by Sales Value USD Million, Y-o-Y Growth (%), and Market Share (%) |
| 11.3.1.Hospitals |
| 11.3.2.Diagnostic Centers |
| 11.3.3.Others |
| 11.4. Country Analysis 2018 - 2022 and Forecast 2023 - 2029 by Sales Value USD Million, Y-o-Y Growth (%), and Market Share (%) |
| 11.4.1.China |
| 11.4.2.India |
| 11.4.3.Australia and New Zealand (ANZ) |
| 11.4.4.Japan |
| 11.4.5.Rest of APAC |
| 12.Middle East and Africa (MEA) Medical Computer Carts Market ,2018 - 2022 and Forecast 2023 - 2029 (Sales Value USD Million) |
| 12.1. Application Analysis and Forecast by Sales Value USD Million, Y-o-Y Growth (%), and Market Share (%) |
| 12.1.1.Documentation |
| 12.1.2.Medical Equipment |
| 12.1.3.Medical Delivery |
| 12.1.4.Telehealth |
| 12.1.5.Others |
| 12.2. Monitor Analysis 2018 - 2022 and Forecast 2023 - 2029 by Sales Value USD Million, Y-o-Y Growth (%), and Market Share (%) |
| 12.2.1.Single Monitor |
| 12.2.2.Double Monitor |
| 12.2.3.Laptop |
| 12.2.4.Tablet |
| 12.3. End User Analysis 2018 - 2022 and Forecast 2023 - 2029 by Sales Value USD Million, Y-o-Y Growth (%), and Market Share (%) |
| 12.3.1.Hospitals |
| 12.3.2.Diagnostic Centers |
| 12.3.3.Others |
| 12.4. Country Analysis 2018 - 2022 and Forecast 2023 - 2029 by Sales Value USD Million, Y-o-Y Growth (%), and Market Share (%) |
| 12.4.1.GCC Countries |
| 12.4.2.South Africa |
| 12.4.3.Rest of MEA |
| 13.Latin America Medical Computer Carts Market ,2018 - 2022 and Forecast 2023 - 2029 (Sales Value USD Million) |
| 13.1. Application Analysis and Forecast by Sales Value USD Million, Y-o-Y Growth (%), and Market Share (%) |
| 13.1.1.Documentation |
| 13.1.2.Medical Equipment |
| 13.1.3.Medical Delivery |
| 13.1.4.Telehealth |
| 13.1.5.Others |
| 13.2. Monitor Analysis 2018 - 2022 and Forecast 2023 - 2029 by Sales Value USD Million, Y-o-Y Growth (%), and Market Share (%) |
| 13.2.1.Single Monitor |
| 13.2.2.Double Monitor |
| 13.2.3.Laptop |
| 13.2.4.Tablet |
| 13.3. End User Analysis 2018 - 2022 and Forecast 2023 - 2029 by Sales Value USD Million, Y-o-Y Growth (%), and Market Share (%) |
| 13.3.1.Hospitals |
| 13.3.2.Diagnostic Centers |
| 13.3.3.Others |
| 13.4. Country Analysis 2018 - 2022 and Forecast 2023 - 2029 by Sales Value USD Million, Y-o-Y Growth (%), and Market Share (%) |
| 13.4.1.Brazil |
| 13.4.2.Mexico |
| 13.4.3.Rest of LA |
| 14. Competition Landscape |
| 14.1. Market Player Profiles (Introduction, Brand/Product Sales, Financial Analysis, Product Offerings, Key Developments, Collaborations, M & A, Strategies, and SWOT Analysis) |
| 14.2.1.Capsa Solutions LLC (U.S.) |
| 14.2.2.Ergotron, Inc. (Melrose Industries plc) (UK) |
| 14.2.3.Enovate Medical (U.S.) |
| 14.2.4.Villard (France) |
| 14.2.5.Parity Medical (UK) |
| 14.2.6.InterMetro Industries Corp. (Emerson Electric) (U.S.) |
| 14.2.7.Humanscale Healthcare (U.S.) |
| 14.2.8.ITD GmBH (Germany) |
| 14.2.9.Compucaddy (U.S.) |
| 14.2.10.Advantech Co., Ltd. (China) |
| 14.2.11.Bytech Healthcare Ltd. (U.K.) |
| 15. Research Methodology |
| 16. Appendix and Abbreviations |
- Capsa Solutions LLC (U.S.)
- Ergotron, Inc. (Melrose Industries plc) (UK)
- Enovate Medical (U.S.)
- Villard (France)
- Parity Medical (UK)
- InterMetro Industries Corp. (Emerson Electric) (U.S.)
- Humanscale Healthcare (U.S.)
- ITD GmBH (Germany)
- Compucaddy (U.S.)
- Advantech Co., Ltd. (China)
- Bytech Healthcare Ltd. (U.K.)
