- Mechanical pest control services
- Chemical pest control services
- Biological pest control services
- Others
Pest Control Services Market size was valued at USD 20.3 billion in 2022 and is expected to reach USD 28.3 billion by 2029 growing at a CAGR of 4.65% from 2023 to 2029. It includes the management of pests such as rodents, termites, bed bugs, cockroaches, and other pests which can cause health hazards to humans. Pest control services are provided to both commercial and industrial establishments. The primary function of these services to maintain hygienic surroundings free of pests. Pest control can be done with various techniques such as mechanical control, chemical control, and biological control among others. Global Pest control services Market growth is driven by growing health concerns and an increase in awareness among people about pest control services. Government initiations for the protection of public health and innovation of newer pest control service methods are anticipated to fuel the pest control services market over the forecast period. Moreover, acquisitions and mergers, collaborations, and innovation of newer pest control methods by the market players also upsurge the revenue of pest control services market. For instance, Companies are developing innovative technical solutions to improve service efficiency in order to win market share in the mature market. Route optimization, online sales, the use of smartphone apps to spot pests, mobile communication technologies to provide real-time technical support in the field, and smarter extranets to provide consumers with more management information are just a few examples.
Pest Control Services Market Key Developments:
- in September 2015, Rentokil purchased U.S. pest control business Steritech to expand pest control services in the North America region. Similarly,
- in March 2015, Terminix has acquired two Canadian pest control companies namely Excel Pest Control and Cabot Pest control for strengthening its pest control business segment in Canada.
Pest Control Services Market Summary
Study Period
2024-2030
Base Year
2023
CAGR
4.65%
Largest Market
North America
Fastest Growing Market
Asia Pacific
Pest Control Services Market Dynamics
Increase in industrialization led to growth in pest control services, rise in insurance based services, change in climatic conditions, and implementation of stringent regulations for production industries, which require pest control process are anticipated to fuel the pest control services market. Moreover, rise in awareness about the pest control among key stakeholders, wider service availability, and high disposable income are expected to boost the pest control services market over the forecast period. However, high cost of pest control services and implementation of stringent regulatory guidelines for pesticides usage are anticipated to hamper the pest control services market.
Key Features of the Reports
- The report provides granular level information about the market size, regional market share, historic market (2019-2023), and forecast (2024-2030)
- The report covers in-detail insights about the competitor's overview, company share analysis, key market developments, and their key strategies
- The report outlines drivers, restraints, unmet needs, and trends that are currently affecting the market
- The report tracks recent innovations, key developments, and start-up details that are actively working in the market
- The report provides a plethora of information about market entry strategies, regulatory framework, and reimbursement scenario

Pest Control Services Market Segmentation
By Service Type
By Pest Type
- Termites
- Rodents
- Insects
- Others
By Application
- Industrial
- Agricultural
- Commercial
- Residential
- Others
Frequently Asked Questions
The pest control services market size was valued at USD 20.3 billion in 2022
The pest control services market key players are: Terminix International Company Ltd. (U.S.) Rollins Inc. (U.S.) Rentokil Initial plc. (U.K.) Pest control Pvt. Ltd. (India) SenesTech, Inc. (U.S.) Ecolab Inc. (U.S.) Massey Services Inc. (U.S.) Sanix Incorporated (Japan) Arrow Exterminators Inc. (U.S.)
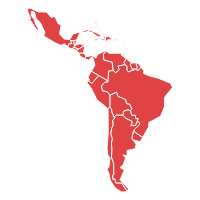
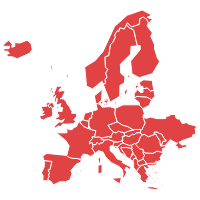
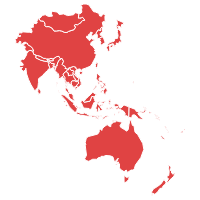
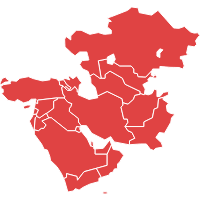
The pest control services market has been classified into North America, Asia Pacific, Europe, Latin America, Middle East and Africa, and the rest of MEA.
| 1. Executive Summary |
| 2. Global Pest Control Services Market Introduction |
| 2.1.Global Pest Control Services Market - Taxonomy |
| 2.2.Global Pest Control Services Market - Definitions |
| 2.2.1.Service Type |
| 2.2.2. Pest Type |
| 2.2.3.Application |
| 2.2.4.Region |
| 3. Global Pest Control Services Market Dynamics |
| 3.1. Drivers |
| 3.2. Restraints |
| 3.3. Opportunities/Unmet Needs of the Market |
| 3.4. Trends |
| 3.5. Product Landscape |
| 3.6. New Product Launches |
| 3.7. Impact of COVID 19 on Market |
| 4. Global Pest Control Services Market Analysis, 2018 - 2022 and Forecast 2023 - 2029 |
| 4.1. Market Analysis, 2018 - 2022 and Forecast, 2023 - 2029, (Sales Value USD Million) |
| 4.2. Year-Over-Year (Y-o-Y) Growth Analysis (%) |
| 4.3. Market Opportunity Analysis |
| 5. Global Pest Control Services Market By Product Type, 2018 - 2022 and Forecast 2023 - 2029 (Sales Value USD Million) |
| 5.1. Mechanical pest control services |
| 5.1.1. Market Analysis, 2018 - 2022 and Forecast, 2023 - 2029, (Sales Value USD Million) |
| 5.1.2. Year-Over-Year (Y-o-Y) Growth Analysis (%) and Market Share Analysis (%) |
| 5.1.3. Market Opportunity Analysis |
| 5.2. Chemical pest control services |
| 5.2.1. Market Analysis, 2018 - 2022 and Forecast, 2023 - 2029, (Sales Value USD Million) |
| 5.2.2. Year-Over-Year (Y-o-Y) Growth Analysis (%) and Market Share Analysis (%) |
| 5.2.3. Market Opportunity Analysis |
| 5.3. Biological pest control services |
| 5.3.1. Market Analysis, 2018 - 2022 and Forecast, 2023 - 2029, (Sales Value USD Million) |
| 5.3.2. Year-Over-Year (Y-o-Y) Growth Analysis (%) and Market Share Analysis (%) |
| 5.3.3. Market Opportunity Analysis |
| 5.4. Others |
| 5.4.1. Market Analysis, 2018 - 2022 and Forecast, 2023 - 2029, (Sales Value USD Million) |
| 5.4.2. Year-Over-Year (Y-o-Y) Growth Analysis (%) and Market Share Analysis (%) |
| 5.4.3. Market Opportunity Analysis |
| 6. Global Pest Control Services Market By Disease Type, 2018 - 2022 and Forecast 2023 - 2029 (Sales Value USD Million) |
| 6.1. Termites |
| 6.1.1. Market Analysis, 2018 - 2022 and Forecast, 2023 - 2029, (Sales Value USD Million) |
| 6.1.2. Year-Over-Year (Y-o-Y) Growth Analysis (%) and Market Share Analysis (%) |
| 6.1.3. Market Opportunity Analysis |
| 6.2. Rodents |
| 6.2.1. Market Analysis, 2018 - 2022 and Forecast, 2023 - 2029, (Sales Value USD Million) |
| 6.2.2. Year-Over-Year (Y-o-Y) Growth Analysis (%) and Market Share Analysis (%) |
| 6.2.3. Market Opportunity Analysis |
| 6.3. Insects |
| 6.3.1. Market Analysis, 2018 - 2022 and Forecast, 2023 - 2029, (Sales Value USD Million) |
| 6.3.2. Year-Over-Year (Y-o-Y) Growth Analysis (%) and Market Share Analysis (%) |
| 6.3.3. Market Opportunity Analysis |
| 6.4. Others |
| 6.4.1. Market Analysis, 2018 - 2022 and Forecast, 2023 - 2029, (Sales Value USD Million) |
| 6.4.2. Year-Over-Year (Y-o-Y) Growth Analysis (%) and Market Share Analysis (%) |
| 6.4.3. Market Opportunity Analysis |
| 7. Global Pest Control Services Market By End Users, 2018 - 2022 and Forecast 2023 - 2029 (Sales Value USD Million) |
| 7.1. Industrial |
| 7.1.1. Market Analysis, 2018 - 2022 and Forecast, 2023 - 2029, (Sales Value USD Million) |
| 7.1.2. Year-Over-Year (Y-o-Y) Growth Analysis (%) and Market Share Analysis (%) |
| 7.1.3. Market Opportunity Analysis |
| 7.2. Agricultural |
| 7.2.1. Market Analysis, 2018 - 2022 and Forecast, 2023 - 2029, (Sales Value USD Million) |
| 7.2.2. Year-Over-Year (Y-o-Y) Growth Analysis (%) and Market Share Analysis (%) |
| 7.2.3. Market Opportunity Analysis |
| 7.3. Commercial |
| 7.3.1. Market Analysis, 2018 - 2022 and Forecast, 2023 - 2029, (Sales Value USD Million) |
| 7.3.2. Year-Over-Year (Y-o-Y) Growth Analysis (%) and Market Share Analysis (%) |
| 7.3.3. Market Opportunity Analysis |
| 7.4. Residential |
| 7.4.1. Market Analysis, 2018 - 2022 and Forecast, 2023 - 2029, (Sales Value USD Million) |
| 7.4.2. Year-Over-Year (Y-o-Y) Growth Analysis (%) and Market Share Analysis (%) |
| 7.4.3. Market Opportunity Analysis |
| 7.5. Others |
| 7.5.1. Market Analysis, 2018 - 2022 and Forecast, 2023 - 2029, (Sales Value USD Million) |
| 7.5.2. Year-Over-Year (Y-o-Y) Growth Analysis (%) and Market Share Analysis (%) |
| 7.5.3. Market Opportunity Analysis |
| 8. Global Pest Control Services Market By Region, 2018 - 2022 and Forecast 2023 - 2029 (Sales Value USD Million) |
| 8.1. North America |
| 8.1.1. Market Analysis, 2018 - 2022 and Forecast, 2023 - 2029, (Sales Value USD Million) |
| 8.1.2. Year-Over-Year (Y-o-Y) Growth Analysis (%) and Market Share Analysis (%) |
| 8.1.3. Market Opportunity Analysis |
| 8.2. Europe |
| 8.2.1. Market Analysis, 2018 - 2022 and Forecast, 2023 - 2029, (Sales Value USD Million) |
| 8.2.2. Year-Over-Year (Y-o-Y) Growth Analysis (%) and Market Share Analysis (%) |
| 8.2.3. Market Opportunity Analysis |
| 8.3. Asia Pacific (APAC) |
| 8.3.1. Market Analysis, 2018 - 2022 and Forecast, 2023 - 2029, (Sales Value USD Million) |
| 8.3.2. Year-Over-Year (Y-o-Y) Growth Analysis (%) and Market Share Analysis (%) |
| 8.3.3. Market Opportunity Analysis |
| 8.4. Middle East and Africa (MEA) |
| 8.4.1. Market Analysis, 2018 - 2022 and Forecast, 2023 - 2029, (Sales Value USD Million) |
| 8.4.2. Year-Over-Year (Y-o-Y) Growth Analysis (%) and Market Share Analysis (%) |
| 8.4.3. Market Opportunity Analysis |
| 8.5. Latin America |
| 8.5.1. Market Analysis, 2018 - 2022 and Forecast, 2023 - 2029, (Sales Value USD Million) |
| 8.5.2. Year-Over-Year (Y-o-Y) Growth Analysis (%) and Market Share Analysis (%) |
| 8.5.3. Market Opportunity Analysis |
| 9. North America Pest Control Services Market,2018 - 2022 and Forecast 2023 - 2029 (Sales Value USD Million) |
| 9.1. Product Type Analysis 2018 - 2022 and Forecast 2023 - 2029 by Sales Value USD Million, Y-o-Y Growth (%), and Market Share (%) |
| 9.1.1.Mechanical pest control services |
| 9.1.2.Chemical pest control services |
| 9.1.3.Biological pest control services |
| 9.1.4.Others |
| 9.2. Disease Type Analysis 2018 - 2022 and Forecast 2023 - 2029 by Sales Value USD Million, Y-o-Y Growth (%), and Market Share (%) |
| 9.2.1.Termites |
| 9.2.2.Rodents |
| 9.2.3.Insects |
| 9.2.4.Others |
| 9.3. End Users Analysis 2018 - 2022 and Forecast 2023 - 2029 by Sales Value USD Million, Y-o-Y Growth (%), and Market Share (%) |
| 9.3.1.Industrial |
| 9.3.2.Agricultural |
| 9.3.3.Commercial |
| 9.3.4.Residential |
| 9.3.5.Others |
| 9.4. Country Analysis 2018 - 2022 and Forecast 2023 - 2029 by Sales Value USD Million, Y-o-Y Growth (%), and Market Share (%) |
| 9.4.1.United States of America (USA) |
| 9.4.2.Canada |
| 10. Europe Pest Control Services Market ,2018 - 2022 and Forecast 2023 - 2029 (Sales Value USD Million) |
| 10.1. Product Type Analysis and Forecast by Sales Value USD Million, Y-o-Y Growth (%), and Market Share (%) |
| 10.1.1.Mechanical pest control services |
| 10.1.2.Chemical pest control services |
| 10.1.3.Biological pest control services |
| 10.1.4.Others |
| 10.2. Disease Type Analysis 2018 - 2022 and Forecast 2023 - 2029 by Sales Value USD Million, Y-o-Y Growth (%), and Market Share (%) |
| 10.2.1.Termites |
| 10.2.2.Rodents |
| 10.2.3.Insects |
| 10.2.4.Others |
| 10.3. End Users Analysis 2018 - 2022 and Forecast 2023 - 2029 by Sales Value USD Million, Y-o-Y Growth (%), and Market Share (%) |
| 10.3.1.Industrial |
| 10.3.2.Agricultural |
| 10.3.3.Commercial |
| 10.3.4.Residential |
| 10.3.5.Others |
| 10.4. Country Analysis 2018 - 2022 and Forecast 2023 - 2029 by Sales Value USD Million, Y-o-Y Growth (%), and Market Share (%) |
| 10.4.1.Germany |
| 10.4.2.France |
| 10.4.3.Italy |
| 10.4.4.United Kingdom (UK) |
| 10.4.5.Spain |
| 10.4.6.Rest of EU |
| 11. Asia Pacific (APAC) Pest Control Services Market,2018 - 2022 and Forecast 2023 - 2029 (Sales Value USD Million) |
| 11.1. Product Type Analysis and Forecast by Sales Value USD Million, Y-o-Y Growth (%), and Market Share (%) |
| 11.1.1.Mechanical pest control services |
| 11.1.2.Chemical pest control services |
| 11.1.3.Biological pest control services |
| 11.1.4.Others |
| 11.2. Disease Type Analysis 2018 - 2022 and Forecast 2023 - 2029 by Sales Value USD Million, Y-o-Y Growth (%), and Market Share (%) |
| 11.2.1.Termites |
| 11.2.2.Rodents |
| 11.2.3.Insects |
| 11.2.4.Others |
| 11.3. End Users Analysis 2018 - 2022 and Forecast 2023 - 2029 by Sales Value USD Million, Y-o-Y Growth (%), and Market Share (%) |
| 11.3.1.Industrial |
| 11.3.2.Agricultural |
| 11.3.3.Commercial |
| 11.3.4.Residential |
| 11.3.5.Others |
| 11.4. Country Analysis 2018 - 2022 and Forecast 2023 - 2029 by Sales Value USD Million, Y-o-Y Growth (%), and Market Share (%) |
| 11.4.1.China |
| 11.4.2.India |
| 11.4.3.Australia and New Zealand (ANZ) |
| 11.4.4.Japan |
| 11.4.5.Rest of APAC |
| 12. Middle East and Africa (MEA) Pest Control Services Market ,2018 - 2022 and Forecast 2023 - 2029 (Sales Value USD Million) |
| 12.1. Product Type Analysis and Forecast by Sales Value USD Million, Y-o-Y Growth (%), and Market Share (%) |
| 12.1.1.Mechanical pest control services |
| 12.1.2.Chemical pest control services |
| 12.1.3.Biological pest control services |
| 12.1.4.Others |
| 12.2. Disease Type Analysis 2018 - 2022 and Forecast 2023 - 2029 by Sales Value USD Million, Y-o-Y Growth (%), and Market Share (%) |
| 12.2.1.Termites |
| 12.2.2.Rodents |
| 12.2.3.Insects |
| 12.2.4.Others |
| 12.3. End Users Analysis 2018 - 2022 and Forecast 2023 - 2029 by Sales Value USD Million, Y-o-Y Growth (%), and Market Share (%) |
| 12.3.1.Industrial |
| 12.3.2.Agricultural |
| 12.3.3.Commercial |
| 12.3.4.Residential |
| 12.3.5.Others |
| 12.4. Country Analysis 2018 - 2022 and Forecast 2023 - 2029 by Sales Value USD Million, Y-o-Y Growth (%), and Market Share (%) |
| 12.4.1.GCC Countries |
| 12.4.2.South Africa |
| 12.4.3.Rest of MEA |
| 13. Latin America Pest Control Services Market,2018 - 2022 and Forecast 2023 - 2029 (Sales Value USD Million) |
| 13.1. Product Type Analysis and Forecast by Sales Value USD Million, Y-o-Y Growth (%), and Market Share (%) |
| 13.1.1.Mechanical pest control services |
| 13.1.2.Chemical pest control services |
| 13.1.3.Biological pest control services |
| 13.1.4.Others |
| 13.2. Disease Type Analysis 2018 - 2022 and Forecast 2023 - 2029 by Sales Value USD Million, Y-o-Y Growth (%), and Market Share (%) |
| 13.2.1.Termites |
| 13.2.2.Rodents |
| 13.2.3.Insects |
| 13.2.4.Others |
| 13.3. End Users Analysis 2018 - 2022 and Forecast 2023 - 2029 by Sales Value USD Million, Y-o-Y Growth (%), and Market Share (%) |
| 13.3.1.Industrial |
| 13.3.2.Agricultural |
| 13.3.3.Commercial |
| 13.3.4.Residential |
| 13.3.5.Others |
| 13.4. Country Analysis 2018 - 2022 and Forecast 2023 - 2029 by Sales Value USD Million, Y-o-Y Growth (%), and Market Share (%) |
| 13.4.1.Brazil |
| 13.4.2.Mexico |
| 13.4.3.Rest of LA |
| 14. Competition Landscape |
| 14.1. Market Player Profiles (Introduction, Brand/Product Sales, Financial Analysis, Product Offerings, Key Developments, Collaborations, M & A, Strategies, and SWOT Analysis) |
| 14.2.1.Terminix International Company Ltd. (U.S.) |
| 14.2.2.Rollins Inc. (U.S.) |
| 14.2.3.Rentokil Initial plc. (U.K.) |
| 14.2.4.Pest control Pvt. Ltd. (India) |
| 14.2.5.SenesTech, Inc. (U.S.) |
| 14.2.6.Ecolab Inc. (U.S.) |
| 14.2.7.Massey Services Inc. (U.S.) |
| 14.2.8.Sanix Incorporated (Japan) |
| 14.2.9.Arrow Exterminators Inc. (U.S.) |
| 15. Research Methodology |
| 16. Appendix and Abbreviations |
- Terminix International Company Ltd. (U.S.)
- Rollins Inc. (U.S.)
- Rentokil Initial plc. (U.K.)
- Pest control Pvt. Ltd. (India)
- SenesTech, Inc. (U.S.)
- Ecolab Inc. (U.S.)
- Massey Services Inc. (U.S.)
- Sanix Incorporated (Japan)
- Arrow Exterminators Inc. (U.S.)
