- Energy Drinks
- Powders
- Juices
- Capsules and Tablets
- Bars
Sports Nutrition Market size was Valued at USD 12.1 billion in 2022 and is poised to grow at a CAGR of 11.8 % from 2023-2029. Nutrition and diet regarding improving athletic performance is called sports nutrition. It is enriched with nutrients like vitamins & minerals and organic substances which consist of proteins, fats, and carbohydrates. Energy drinks, sports drinks, sports food, and supplements are sports nutrition products developed for bodybuilders, athletes, and sports persons to enhance health, and muscle power and improve performance. The vital role is to replenish the water level in the body. This Market is anticipated to grow at a significant rate during the forecast period due to a surge in demand for sports nutrition from sportspersons and athletes. Rising competition among players due to new entrants, consumer inclination towards innovative products with additional nutritional benefits, and availability of new flavors is expected to increase market share. Market players are focused on new product developments, acquisitions and mergers, agreements and collaborations, and partnerships in order to strengthen their presence in the market. Pepsico reformulated its existing products in sports nutrition by reducing salt, fat, and sugar content, Nestle India has launched MILO READY TO DRINK for kids, and Garden of Life entered into sports nutrition market by launching Garden of Life SPORT.
Sports Nutrition Market Summary
Study Period
2024-2030
Base Year
2023
CAGR
11.8%
Largest Market
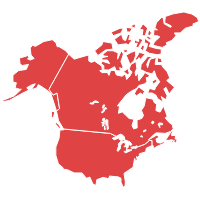
North America
Fastest Growing Market
Asia pacific
Sports Nutrition Market Dynamics
Rise in number of health clubs and fitness centers, growing number of lifestyle users and recreational users are expected to witness healthy growth opportunities. Furthermore, rise in awareness regarding benefits of protein diet for sports, increase the awareness regarding health concerns, middle age people participating in sports and indulging in fitness activities are other factors expected to fuel growth of sports nutrition market across the globe. However, misleading claims and false perceptions about the products, availability of counterfeit products are major restraints of sports nutrition market.
Key Features of the Reports
- The report provides granular level information about the market size, regional market share, historic market (2019-2023), and forecast (2024-2030)
- The report covers in-detail insights about the competitor's overview, company share analysis, key market developments, and their key strategies
- The report outlines drivers, restraints, unmet needs, and trends that are currently affecting the market
- The report tracks recent innovations, key developments, and start-up details that are actively working in the market
- The report provides a plethora of information about market entry strategies, regulatory framework, and reimbursement scenario

Sports Nutrition Market Segmentation
By Type
By Distribution Channel
- Retail Pharmacies
- Drug Specialty Stores
- Fitness Stores
- Supermarkets/Hypermarkets
- E-commerce
By Geography
- North America
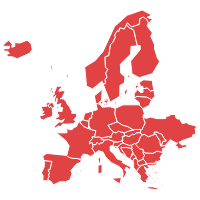
- Europe
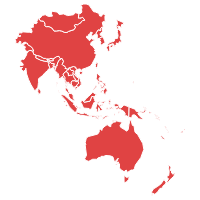
- Asia-Pacific
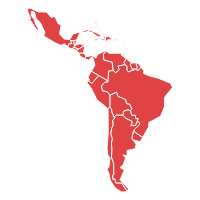
- Latin America
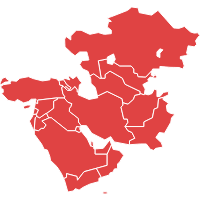
- Middle East and Africa (MEA)
Frequently Asked Questions
The sports nutrition market size was valued at USD 12.1 billion in 2022
The sports nutrition market's key players are Abbott Nutrition Inc. The Coca-Cola Company PepsiCo Inc. Reckitt Benckiser Group plc Glanbia Plc. Yakult Honsha Co Ltd Otsuka Pharmaceuticals Co., Ltd GlaxoSmithKline PLC Atlantic Multipower UK Limited Olimp Laboratories PowerBar Europe GmbH Ultimate Nutrition Inc
The sports nutrition market has been classified into North America, Asia Pacific, Europe, Latin America, Middle East and Africa, and the rest of MEA.
| 1. Executive Summary |
| 2. Global Sports Nutrition Market Introduction |
| 2.1.Global Sports Nutrition Market - Taxonomy |
| 2.2.Global Sports Nutrition Market - Definitions |
| 2.2.1. Type |
| 2.2.2.Distribution Channel |
| 2.2.3.Geography |
| 2.2.4.Region |
| 3. Global Sports Nutrition Market Dynamics |
| 3.1. Drivers |
| 3.2. Restraints |
| 3.3. Opportunities/Unmet Needs of the Market |
| 3.4. Trends |
| 3.5. Product Landscape |
| 3.6. New Product Launches |
| 3.7. Impact of COVID 19 on Market |
| 4. Global Sports Nutrition Market Analysis, 2018 - 2022 and Forecast 2023 - 2029 |
| 4.1. Market Analysis, 2018 - 2022 and Forecast, 2023 - 2029, (Sales Value USD Million) |
| 4.2. Year-Over-Year (Y-o-Y) Growth Analysis (%) |
| 4.3. Market Opportunity Analysis |
| 5.Global Sports Nutrition Market By Type , 2018 - 2022 and Forecast 2023 - 2029 (Sales Value USD Million) |
| 5.1. Energy Drinks |
| 5.1.1. Market Analysis, 2018 - 2022 and Forecast, 2023 - 2029, (Sales Value USD Million) |
| 5.1.2. Year-Over-Year (Y-o-Y) Growth Analysis (%) and Market Share Analysis (%) |
| 5.1.3. Market Opportunity Analysis |
| 5.2. Powders |
| 5.2.1. Market Analysis, 2018 - 2022 and Forecast, 2023 - 2029, (Sales Value USD Million) |
| 5.2.2. Year-Over-Year (Y-o-Y) Growth Analysis (%) and Market Share Analysis (%) |
| 5.2.3. Market Opportunity Analysis |
| 5.3. Juices |
| 5.3.1. Market Analysis, 2018 - 2022 and Forecast, 2023 - 2029, (Sales Value USD Million) |
| 5.3.2. Year-Over-Year (Y-o-Y) Growth Analysis (%) and Market Share Analysis (%) |
| 5.3.3. Market Opportunity Analysis |
| 5.4. Capsules and Tablets |
| 5.4.1. Market Analysis, 2018 - 2022 and Forecast, 2023 - 2029, (Sales Value USD Million) |
| 5.4.2. Year-Over-Year (Y-o-Y) Growth Analysis (%) and Market Share Analysis (%) |
| 5.4.3. Market Opportunity Analysis |
| 5.5. Bars |
| 5.5.1. Market Analysis, 2018 - 2022 and Forecast, 2023 - 2029, (Sales Value USD Million) |
| 5.5.2. Year-Over-Year (Y-o-Y) Growth Analysis (%) and Market Share Analysis (%) |
| 5.5.3. Market Opportunity Analysis |
| 6. Global Sports Nutrition Market By Distribution Channel, 2018 - 2022 and Forecast 2023 - 2029 (Sales Value USD Million) |
| 6.1. Retail Pharmacies |
| 6.1.1. Market Analysis, 2018 - 2022 and Forecast, 2023 - 2029, (Sales Value USD Million) |
| 6.1.2. Year-Over-Year (Y-o-Y) Growth Analysis (%) and Market Share Analysis (%) |
| 6.1.3. Market Opportunity Analysis |
| 6.2. Drug Specialty Stores |
| 6.2.1. Market Analysis, 2018 - 2022 and Forecast, 2023 - 2029, (Sales Value USD Million) |
| 6.2.2. Year-Over-Year (Y-o-Y) Growth Analysis (%) and Market Share Analysis (%) |
| 6.2.3. Market Opportunity Analysis |
| 6.3. Fitness Stores |
| 6.3.1. Market Analysis, 2018 - 2022 and Forecast, 2023 - 2029, (Sales Value USD Million) |
| 6.3.2. Year-Over-Year (Y-o-Y) Growth Analysis (%) and Market Share Analysis (%) |
| 6.3.3. Market Opportunity Analysis |
| 6.4. Supermarkets/Hypermarkets |
| 6.4.1. Market Analysis, 2018 - 2022 and Forecast, 2023 - 2029, (Sales Value USD Million) |
| 6.4.2. Year-Over-Year (Y-o-Y) Growth Analysis (%) and Market Share Analysis (%) |
| 6.4.3. Market Opportunity Analysis |
| 6.5. E-commerce |
| 6.5.1. Market Analysis, 2018 - 2022 and Forecast, 2023 - 2029, (Sales Value USD Million) |
| 6.5.2. Year-Over-Year (Y-o-Y) Growth Analysis (%) and Market Share Analysis (%) |
| 6.5.3. Market Opportunity Analysis |
| 7. Global Sports Nutrition Market By Geography, 2018 - 2022 and Forecast 2023 - 2029 (Sales Value USD Million) |
| 7.1. North America |
| 7.1.1. Market Analysis, 2018 - 2022 and Forecast, 2023 - 2029, (Sales Value USD Million) |
| 7.1.2. Year-Over-Year (Y-o-Y) Growth Analysis (%) and Market Share Analysis (%) |
| 7.1.3. Market Opportunity Analysis |
| 7.2. Europe |
| 7.2.1. Market Analysis, 2018 - 2022 and Forecast, 2023 - 2029, (Sales Value USD Million) |
| 7.2.2. Year-Over-Year (Y-o-Y) Growth Analysis (%) and Market Share Analysis (%) |
| 7.2.3. Market Opportunity Analysis |
| 7.3. Asia-Pacific |
| 7.3.1. Market Analysis, 2018 - 2022 and Forecast, 2023 - 2029, (Sales Value USD Million) |
| 7.3.2. Year-Over-Year (Y-o-Y) Growth Analysis (%) and Market Share Analysis (%) |
| 7.3.3. Market Opportunity Analysis |
| 7.4. Latin America |
| 7.4.1. Market Analysis, 2018 - 2022 and Forecast, 2023 - 2029, (Sales Value USD Million) |
| 7.4.2. Year-Over-Year (Y-o-Y) Growth Analysis (%) and Market Share Analysis (%) |
| 7.4.3. Market Opportunity Analysis |
| 7.5. Middle East and Africa (MEA) |
| 7.5.1. Market Analysis, 2018 - 2022 and Forecast, 2023 - 2029, (Sales Value USD Million) |
| 7.5.2. Year-Over-Year (Y-o-Y) Growth Analysis (%) and Market Share Analysis (%) |
| 7.5.3. Market Opportunity Analysis |
| 8. Global Sports Nutrition Market By Region, 2018 - 2022 and Forecast 2023 - 2029 (Sales Value USD Million) |
| 8.1. North America |
| 8.1.1. Market Analysis, 2018 - 2022 and Forecast, 2023 - 2029, (Sales Value USD Million) |
| 8.1.2. Year-Over-Year (Y-o-Y) Growth Analysis (%) and Market Share Analysis (%) |
| 8.1.3. Market Opportunity Analysis |
| 8.2. Europe |
| 8.2.1. Market Analysis, 2018 - 2022 and Forecast, 2023 - 2029, (Sales Value USD Million) |
| 8.2.2. Year-Over-Year (Y-o-Y) Growth Analysis (%) and Market Share Analysis (%) |
| 8.2.3. Market Opportunity Analysis |
| 8.3. Asia Pacific (APAC) |
| 8.3.1. Market Analysis, 2018 - 2022 and Forecast, 2023 - 2029, (Sales Value USD Million) |
| 8.3.2. Year-Over-Year (Y-o-Y) Growth Analysis (%) and Market Share Analysis (%) |
| 8.3.3. Market Opportunity Analysis |
| 8.4. Middle East and Africa (MEA) |
| 8.4.1. Market Analysis, 2018 - 2022 and Forecast, 2023 - 2029, (Sales Value USD Million) |
| 8.4.2. Year-Over-Year (Y-o-Y) Growth Analysis (%) and Market Share Analysis (%) |
| 8.4.3. Market Opportunity Analysis |
| 8.5. Latin America |
| 8.5.1. Market Analysis, 2018 - 2022 and Forecast, 2023 - 2029, (Sales Value USD Million) |
| 8.5.2. Year-Over-Year (Y-o-Y) Growth Analysis (%) and Market Share Analysis (%) |
| 8.5.3. Market Opportunity Analysis |
| 9. North America Sports Nutrition Market,2018 - 2022 and Forecast 2023 - 2029 (Sales Value USD Million) |
| 9.1. Type Analysis 2018 - 2022 and Forecast 2023 - 2029 by Sales Value USD Million, Y-o-Y Growth (%), and Market Share (%) |
| 9.1.1.Energy Drinks |
| 9.1.2.Powders |
| 9.1.3.Juices |
| 9.1.4.Capsules and Tablets |
| 9.1.5.Bars |
| 9.2. Distribution Channel Analysis 2018 - 2022 and Forecast 2023 - 2029 by Sales Value USD Million, Y-o-Y Growth (%), and Market Share (%) |
| 9.2.1.Retail Pharmacies |
| 9.2.2.Drug Specialty Stores |
| 9.2.3.Fitness Stores |
| 9.2.4.Supermarkets/Hypermarkets |
| 9.2.5.E-commerce |
| 9.3. Geography Analysis 2018 - 2022 and Forecast 2023 - 2029 by Sales Value USD Million, Y-o-Y Growth (%), and Market Share (%) |
| 9.3.1.North America |
| 9.3.2.Europe |
| 9.3.3.Asia-Pacific |
| 9.3.4.Latin America |
| 9.3.5.Middle East and Africa (MEA) |
| 9.4. Country Analysis 2018 - 2022 and Forecast 2023 - 2029 by Sales Value USD Million, Y-o-Y Growth (%), and Market Share (%) |
| 9.4.1.United States of America (USA) |
| 9.4.2.Canada |
| 10. Europe Sports Nutrition Market,2018 - 2022 and Forecast 2023 - 2029 (Sales Value USD Million) |
| 10.1. Type Analysis and Forecast by Sales Value USD Million, Y-o-Y Growth (%), and Market Share (%) |
| 10.1.1.Energy Drinks |
| 10.1.2.Powders |
| 10.1.3.Juices |
| 10.1.4.Capsules and Tablets |
| 10.1.5.Bars |
| 10.2. Distribution Channel Analysis 2018 - 2022 and Forecast 2023 - 2029 by Sales Value USD Million, Y-o-Y Growth (%), and Market Share (%) |
| 10.2.1.Retail Pharmacies |
| 10.2.2.Drug Specialty Stores |
| 10.2.3.Fitness Stores |
| 10.2.4.Supermarkets/Hypermarkets |
| 10.2.5.E-commerce |
| 10.3. Geography Analysis 2018 - 2022 and Forecast 2023 - 2029 by Sales Value USD Million, Y-o-Y Growth (%), and Market Share (%) |
| 10.3.1.North America |
| 10.3.2.Europe |
| 10.3.3.Asia-Pacific |
| 10.3.4.Latin America |
| 10.3.5.Middle East and Africa (MEA) |
| 10.4. Country Analysis 2018 - 2022 and Forecast 2023 - 2029 by Sales Value USD Million, Y-o-Y Growth (%), and Market Share (%) |
| 10.4.1.Germany |
| 10.4.2.France |
| 10.4.3.Italy |
| 10.4.4.United Kingdom (UK) |
| 10.4.5.Spain |
| 10.4.6.Rest of EU |
| 11. Asia Pacific (APAC) Sports Nutrition Market,2018 - 2022 and Forecast 2023 - 2029 (Sales Value USD Million) |
| 11.1. Type Analysis and Forecast by Sales Value USD Million, Y-o-Y Growth (%), and Market Share (%) |
| 11.1.1.Energy Drinks |
| 11.1.2.Powders |
| 11.1.3.Juices |
| 11.1.4.Capsules and Tablets |
| 11.1.5.Bars |
| 11.2. Distribution Channel Analysis 2018 - 2022 and Forecast 2023 - 2029 by Sales Value USD Million, Y-o-Y Growth (%), and Market Share (%) |
| 11.2.1.Retail Pharmacies |
| 11.2.2.Drug Specialty Stores |
| 11.2.3.Fitness Stores |
| 11.2.4.Supermarkets/Hypermarkets |
| 11.2.5.E-commerce |
| 11.3. Geography Analysis 2018 - 2022 and Forecast 2023 - 2029 by Sales Value USD Million, Y-o-Y Growth (%), and Market Share (%) |
| 11.3.1.North America |
| 11.3.2.Europe |
| 11.3.3.Asia-Pacific |
| 11.3.4.Latin America |
| 11.3.5.Middle East and Africa (MEA) |
| 11.4. Country Analysis 2018 - 2022 and Forecast 2023 - 2029 by Sales Value USD Million, Y-o-Y Growth (%), and Market Share (%) |
| 11.4.1.China |
| 11.4.2.India |
| 11.4.3.Australia and New Zealand (ANZ) |
| 11.4.4.Japan |
| 11.4.5.Rest of APAC |
| 12. Middle East and Africa (MEA) Sports Nutrition Market,2018 - 2022 and Forecast 2023 - 2029 (Sales Value USD Million) |
| 12.1. Type Analysis and Forecast by Sales Value USD Million, Y-o-Y Growth (%), and Market Share (%) |
| 12.1.1.Energy Drinks |
| 12.1.2.Powders |
| 12.1.3.Juices |
| 12.1.4.Capsules and Tablets |
| 12.1.5.Bars |
| 12.2. Distribution Channel Analysis 2018 - 2022 and Forecast 2023 - 2029 by Sales Value USD Million, Y-o-Y Growth (%), and Market Share (%) |
| 12.2.1.Retail Pharmacies |
| 12.2.2.Drug Specialty Stores |
| 12.2.3.Fitness Stores |
| 12.2.4.Supermarkets/Hypermarkets |
| 12.2.5.E-commerce |
| 12.3. Geography Analysis 2018 - 2022 and Forecast 2023 - 2029 by Sales Value USD Million, Y-o-Y Growth (%), and Market Share (%) |
| 12.3.1.North America |
| 12.3.2.Europe |
| 12.3.3.Asia-Pacific |
| 12.3.4.Latin America |
| 12.3.5.Middle East and Africa (MEA) |
| 12.4. Country Analysis 2018 - 2022 and Forecast 2023 - 2029 by Sales Value USD Million, Y-o-Y Growth (%), and Market Share (%) |
| 12.4.1.GCC Countries |
| 12.4.2.South Africa |
| 12.4.3.Rest of MEA |
| 13. Latin America Sports Nutrition Market,2018 - 2022 and Forecast 2023 - 2029 (Sales Value USD Million) |
| 13.1. Type Analysis and Forecast by Sales Value USD Million, Y-o-Y Growth (%), and Market Share (%) |
| 13.1.1.Energy Drinks |
| 13.1.2.Powders |
| 13.1.3.Juices |
| 13.1.4.Capsules and Tablets |
| 13.1.5.Bars |
| 13.2. Distribution Channel Analysis 2018 - 2022 and Forecast 2023 - 2029 by Sales Value USD Million, Y-o-Y Growth (%), and Market Share (%) |
| 13.2.1.Retail Pharmacies |
| 13.2.2.Drug Specialty Stores |
| 13.2.3.Fitness Stores |
| 13.2.4.Supermarkets/Hypermarkets |
| 13.2.5.E-commerce |
| 13.3. Geography Analysis 2018 - 2022 and Forecast 2023 - 2029 by Sales Value USD Million, Y-o-Y Growth (%), and Market Share (%) |
| 13.3.1.North America |
| 13.3.2.Europe |
| 13.3.3.Asia-Pacific |
| 13.3.4.Latin America |
| 13.3.5.Middle East and Africa (MEA) |
| 13.4. Country Analysis 2018 - 2022 and Forecast 2023 - 2029 by Sales Value USD Million, Y-o-Y Growth (%), and Market Share (%) |
| 13.4.1.Brazil |
| 13.4.2.Mexico |
| 13.4.3.Rest of LA | _x000
