- 3D Printers
- 3D Bio-Printers
- Materials
- Software and services
3D Printed Medical Devices Market size is valued at USD 1.54 billion in 2022 and is expected to reach USD 2.42 billion by 2028 at a significant CAGR of 18.8% from 2023-2029. The low growth is mainly due to lockdowns imposed by governments around the world, which impeded the supply chain in the manufacturing sector of medical devices. Growing demand for organ transplants over the forecast period is expected to fuel growth in the global market for 3D printed medical devices. For example, according to the Healthcare Systems Bureau of Health Resources and Services Administration, as of July 2019 more than 113,000 people are on the U.S. national transplant waiting list. Less materials is appropriate for medical device 3D printing which is expected to inhibit market development. Additionally, the small size of 3D printers limits the size of the finished product which might not be feasible for the development of parts of large industrial machinery. This in turn is expected to hinder business growth. This study analyses the global market dynamics in a detailed manner to identify current trends and drivers, growth opportunities and potential challenges to the key stakeholders in the operating market. In addition, PBI has analyzed the global market to better equip customers with possible investment opportunities across region and consumer unmet needs.
3D Printed Medical Devices Market Key Development
- In Mar 2022, 3D Systems and Enhatch partnered to deliver 3D printed medical devices. The firms will combine their respective skills and technologies to develop an optimized, automated, and scalable workflow for fabricating medical devices as part of the agreement.
- In Jan 2021, ZARE acquired Proxera. ZARE is uniquely well-positioned to address a growing demand for customisable patient-specific medical implants as a result of the acquisition.
3d Printed Medical Devices Market Summary
Study Period
2024-2030
Base Year
2023
CAGR
18.8%
Largest Market
Asia Pacific
Fastest Growing Market
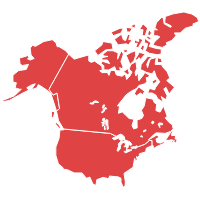
North America
3D Printed Medical Devices Market Dynamics
Vast technological advances in the field of 3D printing over the past few years, in terms of printing technologies, materials and available devices, have served as a springboard for the medical devices industry for the profound modernization that is possible through 3D printing in todays medical devices. In the next few years, the global demand for 3D printing medical devices is expected to grow at a promising rate as the healthcare industry, healthcare professionals, as well as patients are gradually embracing 3D-printed medical devices. The range of 3D-printed medical device applications such as prosthetics and implants, dental restorations, surgical instruments, and tissue manufacturing, and the great demand for these products across the globe are working together in favor of the global market for 3D printing medical devices.
3d Printed Medical Devices Market Segmentation
By Product
By Application
- Implants
- Tissue engineering
- External Wearable Device
By Technology
- Laser Beam Melting
- Photo polymerization
- 3D Printing
- Electron Beam Melting
- Droplet Deposition
By End User
- Hospitals,
- Academic Institutes,
- CROs and
- Pharma & biotech companies
By Geography
- North America
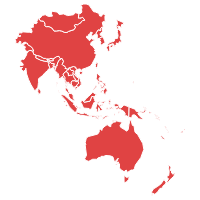
- Asia Pacific
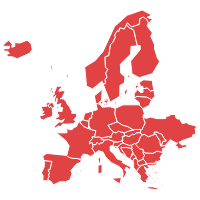
- Europe
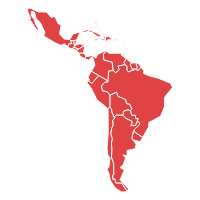
- Latin America
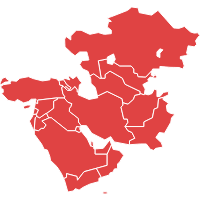
- Middle East and Africa,
Frequently Asked Questions
The 3D printed medical devices market size was valued at USD 1.54 billion in 2022.
The 3D printed medical devices market has been classified into North America, Asia Pacific, Europe, Latin America, Middle East and Africa, and the rest of MEA.
The 3D printed medical devices market key player is Prodways Group, Formlabs, Stratasys Ltd, 3D Systems Inc, Materialise NV, Organovo Holdings Inc, Renishaw plc, GENERAL ELECTRICS, Carbon Inc.
Key Features of the Reports

| 1.Executive Summary |
| 2.Global 3D Printed Medical Devices Market Introduction |
| 2.1.Global 3D Printed Medical Devices Market - Taxonomy |
| 2.2.Global 3D Printed Medical Devices Market - Definitions |
| 2.2.1.Product |
| 2.2.2.Application |
| 2.2.3.Technology |
| 2.2.4.End User |
| 2.2.5.Region |
| 3.Global 3D Printed Medical Devices Market Dynamics |
| 3.1. Drivers |
| 3.2. Restraints |
| 3.3. Opportunities/Unmet Needs of the Market |
| 3.4. Trends |
| 3.5. Product Landscape |
| 3.6. New Product Launches |
| 3.7. Impact of COVID 19 on Market |
| 4.Global 3D Printed Medical Devices Market Analysis, 2018 - 2022 and Forecast 2023 - 2029 |
| 4.1. Market Analysis, 2018 - 2022 and Forecast, 2023 - 2029, (Sales Value USD Million) |
| 4.2. Year-Over-Year (Y-o-Y) Growth Analysis (%) |
| 4.3. Market Opportunity Analysis |
| 5.Global 3D Printed Medical Devices Market By Product, 2018 - 2022 and Forecast 2023 - 2029 (Sales Value USD Million) |
| 5.1. 3D Printers |
| 5.1.1. Market Analysis, 2018 - 2022 and Forecast, 2023 - 2029, (Sales Value USD Million) |
| 5.1.2. Year-Over-Year (Y-o-Y) Growth Analysis (%) and Market Share Analysis (%) |
| 5.1.3. Market Opportunity Analysis |
| 5.2. 3D Bio-Printers |
| 5.2.1. Market Analysis, 2018 - 2022 and Forecast, 2023 - 2029, (Sales Value USD Million) |
| 5.2.2. Year-Over-Year (Y-o-Y) Growth Analysis (%) and Market Share Analysis (%) |
| 5.2.3. Market Opportunity Analysis |
| 5.3. Materials |
| 5.3.1. Market Analysis, 2018 - 2022 and Forecast, 2023 - 2029, (Sales Value USD Million) |
| 5.3.2. Year-Over-Year (Y-o-Y) Growth Analysis (%) and Market Share Analysis (%) |
| 5.3.3. Market Opportunity Analysis |
| 5.4. Software and services |
| 5.4.1. Market Analysis, 2018 - 2022 and Forecast, 2023 - 2029, (Sales Value USD Million) |
| 5.4.2. Year-Over-Year (Y-o-Y) Growth Analysis (%) and Market Share Analysis (%) |
| 5.4.3. Market Opportunity Analysis |
| 6.Global 3D Printed Medical Devices Market By Application, 2018 - 2022 and Forecast 2023 - 2029 (Sales Value USD Million) |
| 6.1. Implants |
| 6.1.1. Market Analysis, 2018 - 2022 and Forecast, 2023 - 2029, (Sales Value USD Million) |
| 6.1.2. Year-Over-Year (Y-o-Y) Growth Analysis (%) and Market Share Analysis (%) |
| 6.1.3. Market Opportunity Analysis |
| 6.2. Tissue engineering |
| 6.2.1. Market Analysis, 2018 - 2022 and Forecast, 2023 - 2029, (Sales Value USD Million) |
| 6.2.2. Year-Over-Year (Y-o-Y) Growth Analysis (%) and Market Share Analysis (%) |
| 6.2.3. Market Opportunity Analysis |
| 6.3. External Wearable Device |
| 6.3.1. Market Analysis, 2018 - 2022 and Forecast, 2023 - 2029, (Sales Value USD Million) |
| 6.3.2. Year-Over-Year (Y-o-Y) Growth Analysis (%) and Market Share Analysis (%) |
| 6.3.3. Market Opportunity Analysis |
| 7.Global 3D Printed Medical Devices Market By Technology, 2018 - 2022 and Forecast 2023 - 2029 (Sales Value USD Million) |
| 7.1. Laser Beam Melting |
| 7.1.1. Market Analysis, 2018 - 2022 and Forecast, 2023 - 2029, (Sales Value USD Million) |
| 7.1.2. Year-Over-Year (Y-o-Y) Growth Analysis (%) and Market Share Analysis (%) |
| 7.1.3. Market Opportunity Analysis |
| 7.2. Photo polymerization |
| 7.2.1. Market Analysis, 2018 - 2022 and Forecast, 2023 - 2029, (Sales Value USD Million) |
| 7.2.2. Year-Over-Year (Y-o-Y) Growth Analysis (%) and Market Share Analysis (%) |
| 7.2.3. Market Opportunity Analysis |
| 7.3. 3D Printing |
| 7.3.1. Market Analysis, 2018 - 2022 and Forecast, 2023 - 2029, (Sales Value USD Million) |
| 7.3.2. Year-Over-Year (Y-o-Y) Growth Analysis (%) and Market Share Analysis (%) |
| 7.3.3. Market Opportunity Analysis |
| 7.4. Electron Beam Melting |
| 7.4.1. Market Analysis, 2018 - 2022 and Forecast, 2023 - 2029, (Sales Value USD Million) |
| 7.4.2. Year-Over-Year (Y-o-Y) Growth Analysis (%) and Market Share Analysis (%) |
| 7.4.3. Market Opportunity Analysis |
| 7.5. Droplet Deposition |
| 7.5.1. Market Analysis, 2018 - 2022 and Forecast, 2023 - 2029, (Sales Value USD Million) |
| 7.5.2. Year-Over-Year (Y-o-Y) Growth Analysis (%) and Market Share Analysis (%) |
| 7.5.3. Market Opportunity Analysis |
| 8.Global 3D Printed Medical Devices Market By End User, 2018 - 2022 and Forecast 2023 - 2029 (Sales Value USD Million) |
| 8.1. Hospitals, |
| 8.1.1. Market Analysis, 2018 - 2022 and Forecast, 2023 - 2029, (Sales Value USD Million) |
| 8.1.2. Year-Over-Year (Y-o-Y) Growth Analysis (%) and Market Share Analysis (%) |
| 8.1.3. Market Opportunity Analysis |
| 8.2. Academic Institutes, |
| 8.2.1. Market Analysis, 2018 - 2022 and Forecast, 2023 - 2029, (Sales Value USD Million) |
| 8.2.2. Year-Over-Year (Y-o-Y) Growth Analysis (%) and Market Share Analysis (%) |
| 8.2.3. Market Opportunity Analysis |
| 8.3. CROs and |
| 8.3.1. Market Analysis, 2018 - 2022 and Forecast, 2023 - 2029, (Sales Value USD Million) |
| 8.3.2. Year-Over-Year (Y-o-Y) Growth Analysis (%) and Market Share Analysis (%) |
| 8.3.3. Market Opportunity Analysis |
| 8.4. Pharma & biotech companies |
| 8.4.1. Market Analysis, 2018 - 2022 and Forecast, 2023 - 2029, (Sales Value USD Million) |
| 8.4.2. Year-Over-Year (Y-o-Y) Growth Analysis (%) and Market Share Analysis (%) |
| 8.4.3. Market Opportunity Analysis |
| 9.Global 3D Printed Medical Devices Market By Region, 2018 - 2022 and Forecast 2023 - 2029 (Sales Value USD Million) |
| 9.1. North America |
| 9.1.1. Market Analysis, 2018 - 2022 and Forecast, 2023 - 2029, (Sales Value USD Million) |
| 9.1.2. Year-Over-Year (Y-o-Y) Growth Analysis (%) and Market Share Analysis (%) |
| 9.1.3. Market Opportunity Analysis |
| 9.2. Europe |
| 9.2.1. Market Analysis, 2018 - 2022 and Forecast, 2023 - 2029, (Sales Value USD Million) |
| 9.2.2. Year-Over-Year (Y-o-Y) Growth Analysis (%) and Market Share Analysis (%) |
| 9.2.3. Market Opportunity Analysis |
| 9.3. Asia Pacific (APAC) |
| 9.3.1. Market Analysis, 2018 - 2022 and Forecast, 2023 - 2029, (Sales Value USD Million) |
| 9.3.2. Year-Over-Year (Y-o-Y) Growth Analysis (%) and Market Share Analysis (%) |
| 9.3.3. Market Opportunity Analysis |
| 9.4. Middle East and Africa (MEA) |
| 9.4.1. Market Analysis, 2018 - 2022 and Forecast, 2023 - 2029, (Sales Value USD Million) |
| 9.4.2. Year-Over-Year (Y-o-Y) Growth Analysis (%) and Market Share Analysis (%) |
| 9.4.3. Market Opportunity Analysis |
| 9.5. Latin America |
| 9.5.1. Market Analysis, 2018 - 2022 and Forecast, 2023 - 2029, (Sales Value USD Million) |
| 9.5.2. Year-Over-Year (Y-o-Y) Growth Analysis (%) and Market Share Analysis (%) |
| 9.5.3. Market Opportunity Analysis |
| 10.North America 3D Printed Medical Devices Market ,2018 - 2022 and Forecast 2023 - 2029 (Sales Value USD Million) |
| 10.1. Product Analysis 2018 - 2022 and Forecast 2023 - 2029 by Sales Value USD Million, Y-o-Y Growth (%), and Market Share (%) |
| 10.1.1.3D Printers |
| 10.1.2.3D Bio-Printers |
| 10.1.3.Materials |
| 10.1.4.Software and services |
| 10.2. Application Analysis 2018 - 2022 and Forecast 2023 - 2029 by Sales Value USD Million, Y-o-Y Growth (%), and Market Share (%) |
| 10.2.1.Implants |
| 10.2.2.Tissue engineering |
| 10.2.3.External Wearable Device |
| 10.3. Technology Analysis 2018 - 2022 and Forecast 2023 - 2029 by Sales Value USD Million, Y-o-Y Growth (%), and Market Share (%) |
| 10.3.1.Laser Beam Melting |
| 10.3.2.Photo polymerization |
| 10.3.3.3D Printing |
| 10.3.4.Electron Beam Melting |
| 10.3.5.Droplet Deposition |
| 10.4. End User Analysis 2018 - 2022 and Forecast 2023 - 2029 by Sales Value USD Million, Y-o-Y Growth (%), and Market Share (%) |
| 10.4.1.Hospitals, |
| 10.4.2.Academic Institutes, |
| 10.4.3.CROs and |
| 10.4.4.Pharma & biotech companies |
| 10.5. Country Analysis 2018 - 2022 and Forecast 2023 - 2029 by Sales Value USD Million, Y-o-Y Growth (%), and Market Share (%) |
| 10.5.1.United States of America (USA) |
| 10.5.2.Canada |
| 11.Europe 3D Printed Medical Devices Market ,2018 - 2022 and Forecast 2023 - 2029 (Sales Value USD Million) |
| 11.1. Product Analysis and Forecast by Sales Value USD Million, Y-o-Y Growth (%), and Market Share (%) |
| 11.1.1.3D Printers |
| 11.1.2.3D Bio-Printers |
| 11.1.3.Materials |
| 11.1.4.Software and services |
| 11.2. Application Analysis 2018 - 2022 and Forecast 2023 - 2029 by Sales Value USD Million, Y-o-Y Growth (%), and Market Share (%) |
| 11.2.1.Implants |
| 11.2.2.Tissue engineering |
| 11.2.3.External Wearable Device |
| 11.3. Technology Analysis 2018 - 2022 and Forecast 2023 - 2029 by Sales Value USD Million, Y-o-Y Growth (%), and Market Share (%) |
| 11.3.1.Laser Beam Melting |
| 11.3.2.Photo polymerization |
| 11.3.3.3D Printing |
| 11.3.4.Electron Beam Melting |
| 11.3.5.Droplet Deposition |
| 11.4. End User Analysis 2018 - 2022 and Forecast 2023 - 2029 by Sales Value USD Million, Y-o-Y Growth (%), and Market Share (%) |
| 11.4.1.Hospitals, |
| 11.4.2.Academic Institutes, |
| 11.4.3.CROs and |
| 11.4.4.Pharma & biotech companies |
| 11.5. Country Analysis 2018 - 2022 and Forecast 2023 - 2029 by Sales Value USD Million, Y-o-Y Growth (%), and Market Share (%) |
| 11.5.1.Germany |
| 11.5.2.France |
| 11.5.3.Italy |
| 11.5.4.United Kingdom (UK) |
| 11.5.5.Spain |
| 11.5.6.Rest of EU |
| 12.Asia Pacific (APAC) 3D Printed Medical Devices Market ,2018 - 2022 and Forecast 2023 - 2029 (Sales Value USD Million) |
| 12.1. Product Analysis and Forecast by Sales Value USD Million, Y-o-Y Growth (%), and Market Share (%) |
| 12.1.1.3D Printers |
| 12.1.2.3D Bio-Printers |
| 12.1.3.Materials |
| 12.1.4.Software and services |
| 12.2. Application Analysis 2018 - 2022 and Forecast 2023 - 2029 by Sales Value USD Million, Y-o-Y Growth (%), and Market Share (%) |
| 12.2.1.Implants |
| 12.2.2.Tissue engineering |
| 12.2.3.External Wearable Device |
| 12.3. Technology Analysis 2018 - 2022 and Forecast 2023 - 2029 by Sales Value USD Million, Y-o-Y Growth (%), and Market Share (%) |
| 12.3.1.Laser Beam Melting |
| 12.3.2.Photo polymerization |
| 12.3.3.3D Printing |
| 12.3.4.Electron Beam Melting |
| 12.3.5.Droplet Deposition |
| 12.4. End User Analysis 2018 - 2022 and Forecast 2023 - 2029 by Sales Value USD Million, Y-o-Y Growth (%), and Market Share (%) |
| 12.4.1.Hospitals, |
| 12.4.2.Academic Institutes, |
| 12.4.3.CROs and |
| 12.4.4.Pharma & biotech companies |
| 12.5. Country Analysis 2018 - 2022 and Forecast 2023 - 2029 by Sales Value USD Million, Y-o-Y Growth (%), and Market Share (%) |
| 12.5.1.China |
| 12.5.2.India |
| 12.5.3.Australia and New Zealand (ANZ) |
| 12.5.4.Japan |
| 12.5.5.Rest of APAC |
| 13.Middle East and Africa (MEA) 3D Printed Medical Devices Market ,2018 - 2022 and Forecast 2023 - 2029 (Sales Value USD Million) |
| 13.1. Product Analysis and Forecast by Sales Value USD Million, Y-o-Y Growth (%), and Market Share (%) |
| 13.1.1.3D Printers |
| 13.1.2.3D Bio-Printers |
| 13.1.3.Materials |
| 13.1.4.Software and services |
| 13.2. Application Analysis 2018 - 2022 and Forecast 2023 - 2029 by Sales Value USD Million, Y-o-Y Growth (%), and Market Share (%) |
| 13.2.1.Implants |
| 13.2.2.Tissue engineering |
| 13.2.3.External Wearable Device |
| 13.3. Technology Analysis 2018 - 2022 and Forecast 2023 - 2029 by Sales Value USD Million, Y-o-Y Growth (%), and Market Share (%) |
| 13.3.1.Laser Beam Melting |
| 13.3.2.Photo polymerization |
| 13.3.3.3D Printing |
| 13.3.4.Electron Beam Melting |
| 13.3.5.Droplet Deposition |
| 13.4. End User Analysis 2018 - 2022 and Forecast 2023 - 2029 by Sales Value USD Million, Y-o-Y Growth (%), and Market Share (%) |
| 13.4.1.Hospitals, |
| 13.4.2.Academic Institutes, |
| 13.4.3.CROs and |
| 13.4.4.Pharma & biotech companies |
| 13.5. Country Analysis 2018 - 2022 and Forecast 2023 - 2029 by Sales Value USD Million, Y-o-Y Growth (%), and Market Share (%) |
| 13.5.1.GCC Countries |
| 13.5.2.South Africa |
| 13.5.3.Rest of MEA |
| 14.Latin America 3D Printed Medical Devices Market ,2018 - 2022 and Forecast 2023 - 2029 (Sales Value USD Million) |
| 14.1. Product Analysis and Forecast by Sales Value USD Million, Y-o-Y Growth (%), and Market Share (%) |
| 14.1.1.3D Printers |
| 14.1.2.3D Bio-Printers |
| 14.1.3.Materials |
| 14.1.4.Software and services |
| 14.2. Application Analysis 2018 - 2022 and Forecast 2023 - 2029 by Sales Value USD Million, Y-o-Y Growth (%), and Market Share (%) |
| 14.2.1.Implants |
| 14.2.2.Tissue engineering |
| 14.2.3.External Wearable Device |
| 14.3. Technology Analysis 2018 - 2022 and Forecast 2023 - 2029 by Sales Value USD Million, Y-o-Y Growth (%), and Market Share (%) |
| 14.3.1.Laser Beam Melting |
| 14.3.2.Photo polymerization |
| 14.3.3.3D Printing |
| 14.3.4.Electron Beam Melting |
| 14.3.5.Droplet Deposition |
| 14.4. End User Analysis 2018 - 2022 and Forecast 2023 - 2029 by Sales Value USD Million, Y-o-Y Growth (%), and Market Share (%) |
| 14.4.1.Hospitals, |
| 14.4.2.Academic Institutes, |
| 14.4.3.CROs and |
| 14.4.4.Pharma & biotech companies |
| 14.5. Country Analysis 2018 - 2022 and Forecast 2023 - 2029 by Sales Value USD Million, Y-o-Y Growth (%), and Market Share (%) |
| 14.5.1.Brazil |
| 14.5.2.Mexico |
| 14.5.3.Rest of LA |
| 15. Competition Landscape |
| 15.1. Market Player Profiles (Introduction, Brand/Product Sales, Financial Analysis, Product Offerings, Key Developments, Collaborations, M & A, Strategies, and SWOT Analysis) |
| 15.2.1.Prodways Group |
| 15.2.2.Formlabs |
| 15.2.3.Stratasys Ltd |
| 15.2.4.3D Systems Inc |
| 15.2.5.Materialise NV |
| 15.2.6.Organovo Holdings Inc |
| 15.2.7.Renishaw plc |
| 15.2.8.GENERAL ELECTRICS |
| 15.2.9.Carbon Inc |
| 16. Research Methodology |
| 17. Appendix and Abbreviations |
- Prodways Group
- Formlabs
- Stratasys Ltd
- 3D Systems Inc
- Materialise NV
- Organovo Holdings Inc
- Renishaw plc
- GENERAL ELECTRICS
- Carbon Inc
