
 Download Sample


Author
Muni Kumar Meravath is a seasoned Healthcare Market Research Analyst with over 6 years of experience in the healthc.....
Automated Liquid Handling Market: By Product Type, By Modality, By End User and Region Forecast 2021-2032
Report ID:877588
Published Date:Nov 2025
No of Pages:208
Format:

Automated Liquid Handling Market size was valued at US$ 1,530.7 million in 2025 and is expected to reach US$ 2,852.6 million by 2032, growing at a significant CAGR of 9.3% from 2026-2032. Automated liquid handling systems are the equipment that are programmed precisely to handle liquids and determine accurate results without any Complications in clinical and research settings. The Automated liquid handling systems play an important role in clinical and research laboratories. Automated liquid handling systems helps to reduce manpower in the laboratories and run more samples with high accuracy and maintain reproducibility. Factors like, increasing adoption of automated liquid handling systems in emerging countries, innovation of new advanced technologies in automated liquid collagen handling systems is expected to drive the growth of the market. In addition, the automated liquid handling system has more safety and efficiency compared to conventional liquid handling systems which is expected to boost the market growth over the forecasted period. Whereas the high cost of automated liquid handling system is expected to hinder the market growth over the forecasted years.
Furthermore, increasing production of vaccine and increasing investment of pharmaceutical industries in the production of vaccine owing to the spread of infectious disease is expected to trigger the growth of market over the forecasted period. Moreover, the increasing focus on genomics and proteomic research is expected to provide opportunity to the market key players. For instance, Novo Holdings invested US$ 40 million in Evosep for providing more customer with solutions robust and high throughput proteomics. Geographically, North America region held the major market share in 2022 and is expected to dominate the global market in the forecasted years.
In January 2021, SPT Labtech acquired Apricot Designs to expand their portfolio in automated solutions for drug discovery, biological structures, genomics, cryo-electron microscopy, biobanking.
Study Period
2026-2032Base Year
2025CAGR
9.3%Largest Market
Asia-PacificFastest Growing Market
North-America
Automated liquid handling market is expected to grow over forecasted period due to the increasing demand for automated liquid handling machine and increased adoption of automated liquid handling systems in clinical and research laboratories in emerging countries. The enhanced safety and efficiency of automated liquid handling systems compared to conventional liquid handling systems and advancement of technology in the liquid handling system workstation is expected to boost the growth of the market over the forecasted period. For instance, Thermo Fisher Scientific Inc. unveiled highly automated real time PCR which can examine about 6000 samples in a day. Thus, the raising adoption of laboratory automation is expected to have a significant growth in the automated liquid handling systems market.
North America automated liquid handling market is likely to hold a significant revenue share, and in the forecasted years, it is predicted to increase rapidly due to the presence of numerous biopharmaceutical firms in this region. the increasing number ongoing research and development projects and adoption of advanced technologies is expected to trigger the market growth in this region.
Asia Pacific region is expected to have a significant growth in the forecasted period due to the rising awareness of automated liquid handling systems, increase in development of research and development sectors in this region and developing clinical and research infrastructure in this region.

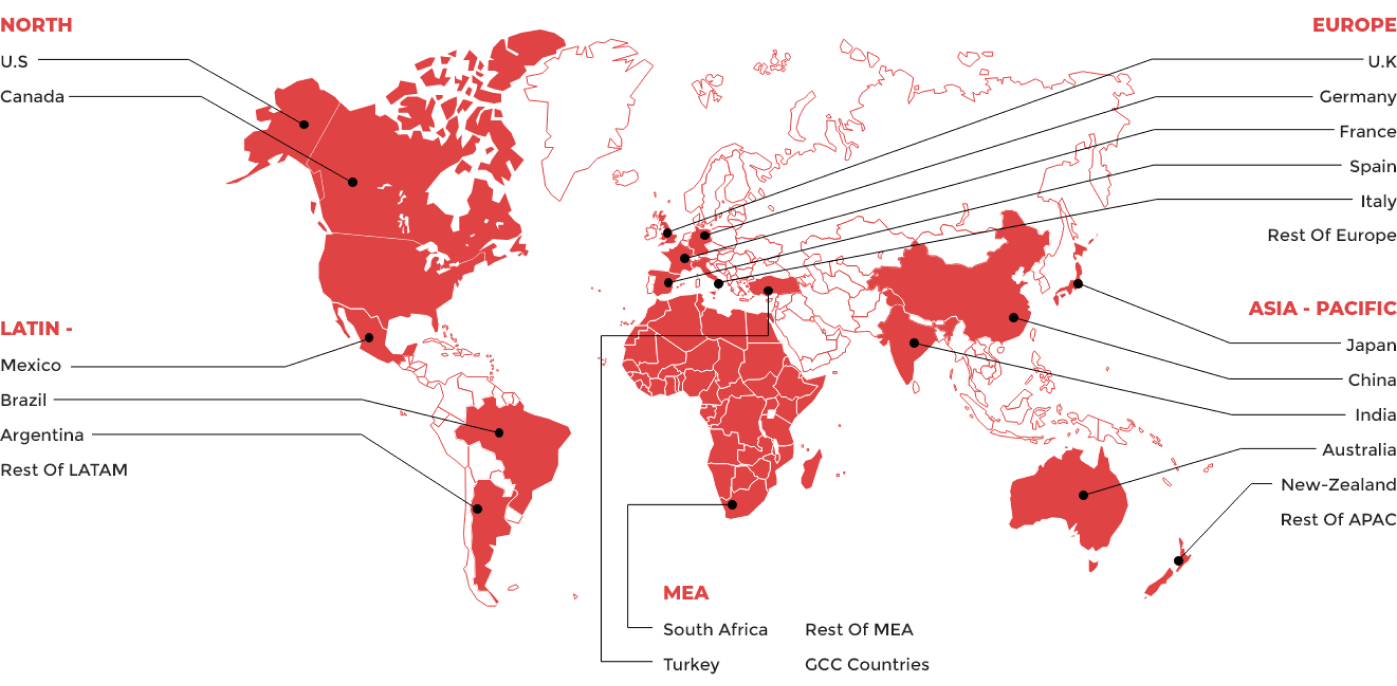
Latin America

Europe

Asia Pacific

Middle East

North America
|
Report Benchmarks |
Details |
|
Report Study Period |
2026-2032 |
|
Market CAGR |
9.3% |
|
By Modality |
|
|
By End User |
|
|
By Region |
|
Download Free Sample Report
![]()
The automated liquid handling market size was valued at US$ 1,530.7 million in 2025 and is expected to reach US$ 2,852.6 million by 2032, growing at a significant CAGR of 9.3% from 2026-2032.
The leading players in the market are Agilent technologies Inc., Aurora Biomed Inc., Thermo Fisher Scientific, Corning Inc., Eppendorf AG, Gilson Inc., Danaher Corporation, Mettler-Toledo International Inc., Tecan Group Ltd, Hamilton Company, Perkin Elmer Inc.
North America region is expected to have a larger market share value in the forecasted years.
Content Updated Date: Mar 2026
| 1. Executive Summary |
| 2. Global Automated Liquid Handling Market Introduction |
| 2.1.Global Automated Liquid Handling Market - Taxonomy |
| 2.2.Global Automated Liquid Handling Market - Definitions |
| 2.2.1.Modality |
| 2.2.2.End Users |
| 2.2.3.Geography |
| 2.2.4.Region |
| 3. Global Automated Liquid Handling Market Dynamics |
| 3.1. Drivers |
| 3.2. Restraints |
| 3.3. Opportunities/Unmet Needs of the Market |
| 3.4. Trends |
| 3.5. Product Landscape |
| 3.6. New Product Launches |
| 3.7. Impact of COVID 19 on Market |
| 4. Global Automated Liquid Handling Market Analysis, 2021 - 2025 and Forecast 2026 - 2032 |
| 4.1. Market Analysis, 2021 - 2025 and Forecast 2026 - 2032, (Sales Value USD Million) |
| 4.2. Year-Over-Year (Y-o-Y) Growth Analysis (%) |
| 4.3. Market Opportunity Analysis |
| 5.Global Automated Liquid Handling Market By Modality, 2021 - 2025 and Forecast 2026 - 2032 (Sales Value USD Million) |
| 5.1. Disposable Tip |
| 5.1.1. Market Analysis, 2021 - 2025 and Forecast 2026 - 2032, (Sales Value USD Million) |
| 5.1.2. Year-Over-Year (Y-o-Y) Growth Analysis (%) and Market Share Analysis (%) |
| 5.1.3. Market Opportunity Analysis |
| 5.2. Fixed Tip |
| 5.2.1. Market Analysis, 2021 - 2025 and Forecast 2026 - 2032, (Sales Value USD Million) |
| 5.2.2. Year-Over-Year (Y-o-Y) Growth Analysis (%) and Market Share Analysis (%) |
| 5.2.3. Market Opportunity Analysis |
| 6.Global Automated Liquid Handling Market By End Users, 2021 - 2025 and Forecast 2026 - 2032 (Sales Value USD Million) |
| 6.1. Hospitals & Diagnostic Centers |
| 6.1.1. Market Analysis, 2021 - 2025 and Forecast 2026 - 2032, (Sales Value USD Million) |
| 6.1.2. Year-Over-Year (Y-o-Y) Growth Analysis (%) and Market Share Analysis (%) |
| 6.1.3. Market Opportunity Analysis |
| 6.2. Pharmaceutical & Biotechnological Institutes |
| 6.2.1. Market Analysis, 2021 - 2025 and Forecast 2026 - 2032, (Sales Value USD Million) |
| 6.2.2. Year-Over-Year (Y-o-Y) Growth Analysis (%) and Market Share Analysis (%) |
| 6.2.3. Market Opportunity Analysis |
| 6.3. Research and Academic Institutes |
| 6.3.1. Market Analysis, 2021 - 2025 and Forecast 2026 - 2032, (Sales Value USD Million) |
| 6.3.2. Year-Over-Year (Y-o-Y) Growth Analysis (%) and Market Share Analysis (%) |
| 6.3.3. Market Opportunity Analysis |
| 6.4. Others |
| 6.4.1. Market Analysis, 2021 - 2025 and Forecast 2026 - 2032, (Sales Value USD Million) |
| 6.4.2. Year-Over-Year (Y-o-Y) Growth Analysis (%) and Market Share Analysis (%) |
| 6.4.3. Market Opportunity Analysis |
| 7.Global Automated Liquid Handling Market By Geography, 2021 - 2025 and Forecast 2026 - 2032 (Sales Value USD Million) |
| 7.1. North America |
| 7.1.1. Market Analysis, 2021 - 2025 and Forecast 2026 - 2032, (Sales Value USD Million) |
| 7.1.2. Year-Over-Year (Y-o-Y) Growth Analysis (%) and Market Share Analysis (%) |
| 7.1.3. Market Opportunity Analysis |
| 7.2. Europe |
| 7.2.1. Market Analysis, 2021 - 2025 and Forecast 2026 - 2032, (Sales Value USD Million) |
| 7.2.2. Year-Over-Year (Y-o-Y) Growth Analysis (%) and Market Share Analysis (%) |
| 7.2.3. Market Opportunity Analysis |
| 7.3. The Asia Pacific |
| 7.3.1. Market Analysis, 2021 - 2025 and Forecast 2026 - 2032, (Sales Value USD Million) |
| 7.3.2. Year-Over-Year (Y-o-Y) Growth Analysis (%) and Market Share Analysis (%) |
| 7.3.3. Market Opportunity Analysis |
| 7.4. Latin America |
| 7.4.1. Market Analysis, 2021 - 2025 and Forecast 2026 - 2032, (Sales Value USD Million) |
| 7.4.2. Year-Over-Year (Y-o-Y) Growth Analysis (%) and Market Share Analysis (%) |
| 7.4.3. Market Opportunity Analysis |
| 7.5. MEA |
| 7.5.1. Market Analysis, 2021 - 2025 and Forecast 2026 - 2032, (Sales Value USD Million) |
| 7.5.2. Year-Over-Year (Y-o-Y) Growth Analysis (%) and Market Share Analysis (%) |
| 7.5.3. Market Opportunity Analysis |
| 8.Global Automated Liquid Handling Market By Region, 2021 - 2025 and Forecast 2026 - 2032 (Sales Value USD Million) |
| 8.1. North America |
| 8.1.1. Market Analysis, 2021 - 2025 and Forecast 2026 - 2032, (Sales Value USD Million) |
| 8.1.2. Year-Over-Year (Y-o-Y) Growth Analysis (%) and Market Share Analysis (%) |
| 8.1.3. Market Opportunity Analysis |
| 8.2. Europe |
| 8.2.1. Market Analysis, 2021 - 2025 and Forecast 2026 - 2032, (Sales Value USD Million) |
| 8.2.2. Year-Over-Year (Y-o-Y) Growth Analysis (%) and Market Share Analysis (%) |
| 8.2.3. Market Opportunity Analysis |
| 8.3. Asia Pacific (APAC) |
| 8.3.1. Market Analysis, 2021 - 2025 and Forecast 2026 - 2032, (Sales Value USD Million) |
| 8.3.2. Year-Over-Year (Y-o-Y) Growth Analysis (%) and Market Share Analysis (%) |
| 8.3.3. Market Opportunity Analysis |
| 8.4. Middle East and Africa (MEA) |
| 8.4.1. Market Analysis, 2021 - 2025 and Forecast 2026 - 2032, (Sales Value USD Million) |
| 8.4.2. Year-Over-Year (Y-o-Y) Growth Analysis (%) and Market Share Analysis (%) |
| 8.4.3. Market Opportunity Analysis |
| 8.5. Latin America |
| 8.5.1. Market Analysis, 2021 - 2025 and Forecast 2026 - 2032, (Sales Value USD Million) |
| 8.5.2. Year-Over-Year (Y-o-Y) Growth Analysis (%) and Market Share Analysis (%) |
| 8.5.3. Market Opportunity Analysis |
| 9.North America Automated Liquid Handling Market ,2021 - 2025 and Forecast 2026 - 2032 (Sales Value USD Million) |
| 9.1. Modality Analysis 2021 - 2025 and Forecast 2026 - 2032 by Sales Value USD Million, Y-o-Y Growth (%), and Market Share (%) |
| 9.1.1.Disposable Tip |
| 9.1.2.Fixed Tip |
| 9.2. End Users Analysis 2021 - 2025 and Forecast 2026 - 2032 by Sales Value USD Million, Y-o-Y Growth (%), and Market Share (%) |
| 9.2.1.Hospitals & Diagnostic Centers |
| 9.2.2.Pharmaceutical & Biotechnological Institutes |
| 9.2.3.Research and Academic Institutes |
| 9.2.4.Others |
| 9.3. Geography Analysis 2021 - 2025 and Forecast 2026 - 2032 by Sales Value USD Million, Y-o-Y Growth (%), and Market Share (%) |
| 9.3.1.North America |
| 9.3.2.Europe |
| 9.3.3.The Asia Pacific |
| 9.3.4.Latin America |
| 9.3.5.MEA |
| 9.4. Country Analysis 2021 - 2025 and Forecast 2026 - 2032 by Sales Value USD Million, Y-o-Y Growth (%), and Market Share (%) |
| 9.4.1.United States of America (USA) |
| 9.4.2.Canada |
| 10.Europe Automated Liquid Handling Market ,2021 - 2025 and Forecast 2026 - 2032 (Sales Value USD Million) |
| 10.1. Modality Analysis and Forecast by Sales Value USD Million, Y-o-Y Growth (%), and Market Share (%) |
| 10.1.1.Disposable Tip |
| 10.1.2.Fixed Tip |
| 10.2. End Users Analysis 2021 - 2025 and Forecast 2026 - 2032 by Sales Value USD Million, Y-o-Y Growth (%), and Market Share (%) |
| 10.2.1.Hospitals & Diagnostic Centers |
| 10.2.2.Pharmaceutical & Biotechnological Institutes |
| 10.2.3.Research and Academic Institutes |
| 10.2.4.Others |
| 10.3. Geography Analysis 2021 - 2025 and Forecast 2026 - 2032 by Sales Value USD Million, Y-o-Y Growth (%), and Market Share (%) |
| 10.3.1.North America |
| 10.3.2.Europe |
| 10.3.3.The Asia Pacific |
| 10.3.4.Latin America |
| 10.3.5.MEA |
| 10.4. Country Analysis 2021 - 2025 and Forecast 2026 - 2032 by Sales Value USD Million, Y-o-Y Growth (%), and Market Share (%) |
| 10.4.1.Germany |
| 10.4.2.France |
| 10.4.3.Italy |
| 10.4.4.United Kingdom (UK) |
| 10.4.5.Spain |
| 10.4.6.Rest of EU |
| 11.Asia Pacific (APAC) Automated Liquid Handling Market ,2021 - 2025 and Forecast 2026 - 2032 (Sales Value USD Million) |
| 11.1. Modality Analysis and Forecast by Sales Value USD Million, Y-o-Y Growth (%), and Market Share (%) |
| 11.1.1.Disposable Tip |
| 11.1.2.Fixed Tip |
| 11.2. End Users Analysis 2021 - 2025 and Forecast 2026 - 2032 by Sales Value USD Million, Y-o-Y Growth (%), and Market Share (%) |
| 11.2.1.Hospitals & Diagnostic Centers |
| 11.2.2.Pharmaceutical & Biotechnological Institutes |
| 11.2.3.Research and Academic Institutes |
| 11.2.4.Others |
| 11.3. Geography Analysis 2021 - 2025 and Forecast 2026 - 2032 by Sales Value USD Million, Y-o-Y Growth (%), and Market Share (%) |
| 11.3.1.North America |
| 11.3.2.Europe |
| 11.3.3.The Asia Pacific |
| 11.3.4.Latin America |
| 11.3.5.MEA |
| 11.4. Country Analysis 2021 - 2025 and Forecast 2026 - 2032 by Sales Value USD Million, Y-o-Y Growth (%), and Market Share (%) |
| 11.4.1.China |
| 11.4.2.India |
| 11.4.3.Australia and New Zealand (ANZ) |
| 11.4.4.Japan |
| 11.4.5.Rest of APAC |
| 12.Middle East and Africa (MEA) Automated Liquid Handling Market ,2021 - 2025 and Forecast 2026 - 2032 (Sales Value USD Million) |
| 12.1. Modality Analysis and Forecast by Sales Value USD Million, Y-o-Y Growth (%), and Market Share (%) |
| 12.1.1.Disposable Tip |
| 12.1.2.Fixed Tip |
| 12.2. End Users Analysis 2021 - 2025 and Forecast 2026 - 2032 by Sales Value USD Million, Y-o-Y Growth (%), and Market Share (%) |
| 12.2.1.Hospitals & Diagnostic Centers |
| 12.2.2.Pharmaceutical & Biotechnological Institutes |
| 12.2.3.Research and Academic Institutes |
| 12.2.4.Others |
| 12.3. Geography Analysis 2021 - 2025 and Forecast 2026 - 2032 by Sales Value USD Million, Y-o-Y Growth (%), and Market Share (%) |
| 12.3.1.North America |
| 12.3.2.Europe |
| 12.3.3.The Asia Pacific |
| 12.3.4.Latin America |
| 12.3.5.MEA |
| 12.4. Country Analysis 2021 - 2025 and Forecast 2026 - 2032 by Sales Value USD Million, Y-o-Y Growth (%), and Market Share (%) |
| 12.4.1.GCC Countries |
| 12.4.2.South Africa |
| 12.4.3.Rest of MEA |
| 13.Latin America Automated Liquid Handling Market ,2021 - 2025 and Forecast 2026 - 2032 (Sales Value USD Million) |
| 13.1. Modality Analysis and Forecast by Sales Value USD Million, Y-o-Y Growth (%), and Market Share (%) |
| 13.1.1.Disposable Tip |
| 13.1.2.Fixed Tip |
| 13.2. End Users Analysis 2021 - 2025 and Forecast 2026 - 2032 by Sales Value USD Million, Y-o-Y Growth (%), and Market Share (%) |
| 13.2.1.Hospitals & Diagnostic Centers |
| 13.2.2.Pharmaceutical & Biotechnological Institutes |
| 13.2.3.Research and Academic Institutes |
| 13.2.4.Others |
| 13.3. Geography Analysis 2021 - 2025 and Forecast 2026 - 2032 by Sales Value USD Million, Y-o-Y Growth (%), and Market Share (%) |
| 13.3.1.North America |
| 13.3.2.Europe |
| 13.3.3.The Asia Pacific |
| 13.3.4.Latin America |
| 13.3.5.MEA |
| 13.4. Country Analysis 2021 - 2025 and Forecast 2026 - 2032 by Sales Value USD Million, Y-o-Y Growth (%), and Market Share (%) |
| 13.4.1.Brazil |
| 13.4.2.Mexico |
| 13.4.3.Rest of LA |
| 14. Competition Landscape |
| 14.1. Market Player Profiles (Introduction, Brand/Product Sales, Financial Analysis, Product Offerings, Key Developments, Collaborations, M & A, Strategies, and SWOT Analysis) |
| 14.2.1.Agilent technologies Inc. |
| 14.2.2.Aurora Biomed Inc. |
| 14.2.3.Thermo Fisher Scientific |
| 14.2.4.Corning Inc. |
| 14.2.5.Eppendorf AG |
| 14.2.6.Gilson Inc. |
| 14.2.7.Danaher Corporation |
| 14.2.8.Mettler-Toledo International Inc. |
| 14.2.9.Tecan Group Ltd |
| 14.2.10.Hamilton Company |
| 14.2.11.Perkin Elmer Inc. |
| 14.2.12.SPT Labtech. |
| 15. Research Methodology |
| 16. Appendix and Abbreviations |
Key Market Players
Author
Muni Kumar Meravath is a seasoned Healthcare Market Research Analyst with over 6 years of experience in the healthcare domain, encompassing pharmaceuticals, medical devices, and diagnostics. A graduate in Pharmacy, he possesses a strong foundation in the intricacies of the healthcare sector. He further enhanced his expertise by pursuing an MBA in Pharmaceuticals, equipping him with valuable business acumen. His analytical skills and market insights have contributed to strategic decision-making and enhanced market positioning for various healthcare organizations. Committed to driving innovation and excellence, Muni continues to seek opportunities to improve healthcare delivery through data-driven insights.