- Activated Alumina
- Activated Charcoal
- Activated Clay
- Alumina Silica Gel
- Metal Oxides
- Polymer Adsorbents
- Zeolites
- Others
Adsorbents Market was valued at USD 4.2 billion in 2022. It is anticipated to grow at USD 5.7 billion by 2029 recording a CAGR of 6.0% from 2023-2029. Oil demand has increased by 30% over the past 20 years, and the next 20 years are likely to prove crucial. Oil and gas will play a very vital role in the energy mix throughout our forecasting period. Oil and gas are growing at a rapid pace. Adsorbents are effective and economical when it comes to removing contaminants during petroleum refining. The removal of contaminants is vital in refineries as it prevents the deactivation of downstream petrochemical catalysts and refinery process catalysts. These can be removed by the application of adsorbents. Therefore, the increase in the global refining capacity has a direct impact on the demand for adsorbents. The global adsorbents market is surging owing to frequent acquisitions and launches by the market players. For Instance, In May 2019, BASF collaborated with Linde for Natural Gas Processing Technology. This collaboration brings together two leading companies in the fields of adsorbents, adsorption, and membrane technology. With the combined capabilities of materials expertise from BASF and engineering expertise from Linde, the two companies are well-positioned to expand their global leadership position in natural gas applications. The global adsorbents market expanding at a significant CAGR due to growing demand for oil and gas across the world. Based on type, the activated alumina segment accounted for a larger market revenue share in 2021 and is projected to gain market revenue share over the forecast period. Players focusing on innovation of newer products and collaboration strategies to retain market position in the global Adsorbents market
Global Adsorbents Market Summary
Study Period
2024-2030
Base Year
2023
CAGR
6%
Largest Market
Asia-Pacific
Fastest Growing Market
North America
Adsorbents Market Dynamics
Some of the key factors fueling the market growth include growing demand for oil and gas across the world, rapid industrialization, increasing awareness for health against pollution and technological advancements in different kinds of adsorbents. However, fluctuation in oil prices is the major factor restricting the market growth.
Key Features of the Reports
- The adsorbents market report provides granular level information about the market size, regional market share, historic market (2018-2022), and forecast (2023-2029)
- The report covers in-detail insights about the competitor’s overview, company share analysis, key market developments, and their key strategies
- The report outlines drivers, restraints, unmet needs, and trends that are currently affecting the market
- The report tracks recent innovations, key developments, and start-up details that are actively working in the market
- The report provides a plethora of information about market entry strategies, regulatory framework, and reimbursement scenario

Global Adsorbents Market Segmentation
By Type
By Application
- Industrial Gas Purification
- Paper/Paper Coatings
- Refrigerants
- Sulfur Recovery
- Transformer Oils
- Water Purification
- Chemical Removal
- Acetylene
- Arsenic
- Fluoride
- Oxygen
- Trace
- Others
By End User
- Air Separation
- Chemicals/Petrochemicals
- Natural Gas
- Nuclear Waste Remediation
- Oil & Gas Refining
- Refrigeration and Air-Conditioning (RAC) Systems
- Volatile Organic Compound (VOC) Removal
- Water Treatment
- Others
Frequently Asked Questions
The adsorbents market size was valued at USD 4.2 billion in 2022
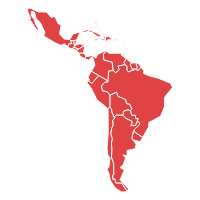
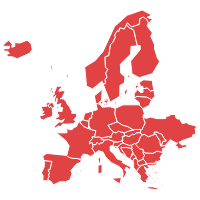
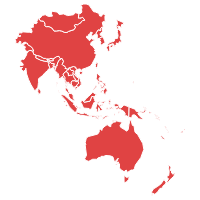
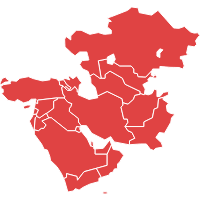
The report covers the five regions and 15+ countries market data: North America (United States, Canada), Europe (Germany, France, Italy, Spain, and United Kingdom (UK), Asia Pacific (China, India, Japan, Australia & New Zealand), Latin America (Brazil, Mexico, Argentina) and Middle East and Africa (Saudi Arabia, United Arab Emirates, South Africa).
The adsorbents market key players are Arkema S.A (France), Axens S.A (France), BASF SE (Germany), Cabot Corporation (U.S.), Calgon Carbon Corporation (U.S)
| 1.Executive Summary |
| 2.Global Adsorbents Market Introduction |
| 2.1.Global Adsorbents Market - Taxonomy |
| 2.2.Global Adsorbents Market - Definitions |
| 2.2.1.Type |
| 2.2.2.Application |
| 2.2.3.End User |
| 2.2.4.Region |
| 3.Global Adsorbents Market Dynamics |
| 3.1. Drivers |
| 3.2. Restraints |
| 3.3. Opportunities/Unmet Needs of the Market |
| 3.4. Trends |
| 3.5. Product Landscape |
| 3.6. New Product Launches |
| 3.7. Impact of COVID 19 on Market |
| 4.Global Adsorbents Market Analysis, 2018 - 2022 and Forecast 2023 - 2029 |
| 4.1. Market Analysis, 2018 - 2022 and Forecast, 2023 - 2029, (Sales Value USD Million) |
| 4.2. Year-Over-Year (Y-o-Y) Growth Analysis (%) |
| 4.3. Market Opportunity Analysis |
| 5.Global Adsorbents Market By Type, 2018 - 2022 and Forecast 2023 - 2029 (Sales Value USD Million) |
| 5.1. Activated Alumina |
| 5.1.1. Market Analysis, 2018 - 2022 and Forecast, 2023 - 2029, (Sales Value USD Million) |
| 5.1.2. Year-Over-Year (Y-o-Y) Growth Analysis (%) and Market Share Analysis (%) |
| 5.1.3. Market Opportunity Analysis |
| 5.2. Activated Charcoal |
| 5.2.1. Market Analysis, 2018 - 2022 and Forecast, 2023 - 2029, (Sales Value USD Million) |
| 5.2.2. Year-Over-Year (Y-o-Y) Growth Analysis (%) and Market Share Analysis (%) |
| 5.2.3. Market Opportunity Analysis |
| 5.3. Activated Clay |
| 5.3.1. Market Analysis, 2018 - 2022 and Forecast, 2023 - 2029, (Sales Value USD Million) |
| 5.3.2. Year-Over-Year (Y-o-Y) Growth Analysis (%) and Market Share Analysis (%) |
| 5.3.3. Market Opportunity Analysis |
| 5.4. Alumina Silica Gel |
| 5.4.1. Market Analysis, 2018 - 2022 and Forecast, 2023 - 2029, (Sales Value USD Million) |
| 5.4.2. Year-Over-Year (Y-o-Y) Growth Analysis (%) and Market Share Analysis (%) |
| 5.4.3. Market Opportunity Analysis |
| 5.5. Metal Oxides |
| 5.5.1. Market Analysis, 2018 - 2022 and Forecast, 2023 - 2029, (Sales Value USD Million) |
| 5.5.2. Year-Over-Year (Y-o-Y) Growth Analysis (%) and Market Share Analysis (%) |
| 5.5.3. Market Opportunity Analysis |
| 5.6. Polymer Adsorbents |
| 5.6.1. Market Analysis, 2018 - 2022 and Forecast, 2023 - 2029, (Sales Value USD Million) |
| 5.6.2. Year-Over-Year (Y-o-Y) Growth Analysis (%) and Market Share Analysis (%) |
| 5.6.3. Market Opportunity Analysis |
| 5.7. Zeolites |
| 5.7.1. Market Analysis, 2018 - 2022 and Forecast, 2023 - 2029, (Sales Value USD Million) |
| 5.7.2. Year-Over-Year (Y-o-Y) Growth Analysis (%) and Market Share Analysis (%) |
| 5.7.3. Market Opportunity Analysis |
| 5.8. Others |
| 5.8.1. Market Analysis, 2018 - 2022 and Forecast, 2023 - 2029, (Sales Value USD Million) |
| 5.8.2. Year-Over-Year (Y-o-Y) Growth Analysis (%) and Market Share Analysis (%) |
| 5.8.3. Market Opportunity Analysis |
| 6.Global Adsorbents Market By Application, 2018 - 2022 and Forecast 2023 - 2029 (Sales Value USD Million) |
| 6.1. Industrial Gas Purification |
| 6.1.1. Market Analysis, 2018 - 2022 and Forecast, 2023 - 2029, (Sales Value USD Million) |
| 6.1.2. Year-Over-Year (Y-o-Y) Growth Analysis (%) and Market Share Analysis (%) |
| 6.1.3. Market Opportunity Analysis |
| 6.2. Paper/Paper Coatings |
| 6.2.1. Market Analysis, 2018 - 2022 and Forecast, 2023 - 2029, (Sales Value USD Million) |
| 6.2.2. Year-Over-Year (Y-o-Y) Growth Analysis (%) and Market Share Analysis (%) |
| 6.2.3. Market Opportunity Analysis |
| 6.3. Refrigerants |
| 6.3.1. Market Analysis, 2018 - 2022 and Forecast, 2023 - 2029, (Sales Value USD Million) |
| 6.3.2. Year-Over-Year (Y-o-Y) Growth Analysis (%) and Market Share Analysis (%) |
| 6.3.3. Market Opportunity Analysis |
| 6.4. Sulfur Recovery |
| 6.4.1. Market Analysis, 2018 - 2022 and Forecast, 2023 - 2029, (Sales Value USD Million) |
| 6.4.2. Year-Over-Year (Y-o-Y) Growth Analysis (%) and Market Share Analysis (%) |
| 6.4.3. Market Opportunity Analysis |
| 6.5. Transformer Oils |
| 6.5.1. Market Analysis, 2018 - 2022 and Forecast, 2023 - 2029, (Sales Value USD Million) |
| 6.5.2. Year-Over-Year (Y-o-Y) Growth Analysis (%) and Market Share Analysis (%) |
| 6.5.3. Market Opportunity Analysis |
| 6.6. Water Purification |
| 6.6.1. Market Analysis, 2018 - 2022 and Forecast, 2023 - 2029, (Sales Value USD Million) |
| 6.6.2. Year-Over-Year (Y-o-Y) Growth Analysis (%) and Market Share Analysis (%) |
| 6.6.3. Market Opportunity Analysis |
| 6.7. Chemical Removal |
| 6.7.1. Market Analysis, 2018 - 2022 and Forecast, 2023 - 2029, (Sales Value USD Million) |
| 6.7.2. Year-Over-Year (Y-o-Y) Growth Analysis (%) and Market Share Analysis (%) |
| 6.7.3. Market Opportunity Analysis |
| 6.8. Acetylene |
| 6.8.1. Market Analysis, 2018 - 2022 and Forecast, 2023 - 2029, (Sales Value USD Million) |
| 6.8.2. Year-Over-Year (Y-o-Y) Growth Analysis (%) and Market Share Analysis (%) |
| 6.8.3. Market Opportunity Analysis |
| 6.9. Arsenic |
| 6.9.1. Market Analysis, 2018 - 2022 and Forecast, 2023 - 2029, (Sales Value USD Million) |
| 6.9.2. Year-Over-Year (Y-o-Y) Growth Analysis (%) and Market Share Analysis (%) |
| 6.9.3. Market Opportunity Analysis |
| 6.10. Fluoride |
| 6.10.1. Market Analysis, 2018 - 2022 and Forecast, 2023 - 2029, (Sales Value USD Million) |
| 6.10.2. Year-Over-Year (Y-o-Y) Growth Analysis (%) and Market Share Analysis (%) |
| 6.10.3. Market Opportunity Analysis |
| 6.11. Oxygen |
| 6.11.1. Market Analysis, 2018 - 2022 and Forecast, 2023 - 2029, (Sales Value USD Million) |
| 6.11.2. Year-Over-Year (Y-o-Y) Growth Analysis (%) and Market Share Analysis (%) |
| 6.11.3. Market Opportunity Analysis |
| 6.12. Trace |
| 6.12.1. Market Analysis, 2018 - 2022 and Forecast, 2023 - 2029, (Sales Value USD Million) |
| 6.12.2. Year-Over-Year (Y-o-Y) Growth Analysis (%) and Market Share Analysis (%) |
| 6.12.3. Market Opportunity Analysis |
| 7.Global Adsorbents Market By End User, 2018 - 2022 and Forecast 2023 - 2029 (Sales Value USD Million) |
| 7.1. Air Separation |
| 7.1.1. Market Analysis, 2018 - 2022 and Forecast, 2023 - 2029, (Sales Value USD Million) |
| 7.1.2. Year-Over-Year (Y-o-Y) Growth Analysis (%) and Market Share Analysis (%) |
| 7.1.3. Market Opportunity Analysis |
| 7.2. Chemicals/Petrochemicals |
| 7.2.1. Market Analysis, 2018 - 2022 and Forecast, 2023 - 2029, (Sales Value USD Million) |
| 7.2.2. Year-Over-Year (Y-o-Y) Growth Analysis (%) and Market Share Analysis (%) |
| 7.2.3. Market Opportunity Analysis |
| 7.3. Natural Gas |
| 7.3.1. Market Analysis, 2018 - 2022 and Forecast, 2023 - 2029, (Sales Value USD Million) |
| 7.3.2. Year-Over-Year (Y-o-Y) Growth Analysis (%) and Market Share Analysis (%) |
| 7.3.3. Market Opportunity Analysis |
| 7.4. Nuclear Waste Remediation |
| 7.4.1. Market Analysis, 2018 - 2022 and Forecast, 2023 - 2029, (Sales Value USD Million) |
| 7.4.2. Year-Over-Year (Y-o-Y) Growth Analysis (%) and Market Share Analysis (%) |
| 7.4.3. Market Opportunity Analysis |
| 7.5. Oil & Gas Refining |
| 7.5.1. Market Analysis, 2018 - 2022 and Forecast, 2023 - 2029, (Sales Value USD Million) |
| 7.5.2. Year-Over-Year (Y-o-Y) Growth Analysis (%) and Market Share Analysis (%) |
| 7.5.3. Market Opportunity Analysis |
| 7.6. Refrigeration and Air-Conditioning (RAC) Systems |
| 7.6.1. Market Analysis, 2018 - 2022 and Forecast, 2023 - 2029, (Sales Value USD Million) |
| 7.6.2. Year-Over-Year (Y-o-Y) Growth Analysis (%) and Market Share Analysis (%) |
| 7.6.3. Market Opportunity Analysis |
| 7.7. Volatile Organic Compound (VOC) Removal |
| 7.7.1. Market Analysis, 2018 - 2022 and Forecast, 2023 - 2029, (Sales Value USD Million) |
| 7.7.2. Year-Over-Year (Y-o-Y) Growth Analysis (%) and Market Share Analysis (%) |
| 7.7.3. Market Opportunity Analysis |
| 7.8. Water Treatment |
| 7.8.1. Market Analysis, 2018 - 2022 and Forecast, 2023 - 2029, (Sales Value USD Million) |
| 7.8.2. Year-Over-Year (Y-o-Y) Growth Analysis (%) and Market Share Analysis (%) |
| 7.8.3. Market Opportunity Analysis |
| 7.9. Others |
| 7.9.1. Market Analysis, 2018 - 2022 and Forecast, 2023 - 2029, (Sales Value USD Million) |
| 7.9.2. Year-Over-Year (Y-o-Y) Growth Analysis (%) and Market Share Analysis (%) |
| 7.9.3. Market Opportunity Analysis |
| 8.Global Adsorbents Market By Region, 2018 - 2022 and Forecast 2023 - 2029 (Sales Value USD Million) |
| 8.1. North America |
| 8.1.1. Market Analysis, 2018 - 2022 and Forecast, 2023 - 2029, (Sales Value USD Million) |
| 8.1.2. Year-Over-Year (Y-o-Y) Growth Analysis (%) and Market Share Analysis (%) |
| 8.1.3. Market Opportunity Analysis |
| 8.2. Europe |
| 8.2.1. Market Analysis, 2018 - 2022 and Forecast, 2023 - 2029, (Sales Value USD Million) |
| 8.2.2. Year-Over-Year (Y-o-Y) Growth Analysis (%) and Market Share Analysis (%) |
| 8.2.3. Market Opportunity Analysis |
| 8.3. Asia Pacific (APAC) |
| 8.3.1. Market Analysis, 2018 - 2022 and Forecast, 2023 - 2029, (Sales Value USD Million) |
| 8.3.2. Year-Over-Year (Y-o-Y) Growth Analysis (%) and Market Share Analysis (%) |
| 8.3.3. Market Opportunity Analysis |
| 8.4. Middle East and Africa (MEA) |
| 8.4.1. Market Analysis, 2018 - 2022 and Forecast, 2023 - 2029, (Sales Value USD Million) |
| 8.4.2. Year-Over-Year (Y-o-Y) Growth Analysis (%) and Market Share Analysis (%) |
| 8.4.3. Market Opportunity Analysis |
| 8.5. Latin America |
| 8.5.1. Market Analysis, 2018 - 2022 and Forecast, 2023 - 2029, (Sales Value USD Million) |
| 8.5.2. Year-Over-Year (Y-o-Y) Growth Analysis (%) and Market Share Analysis (%) |
| 8.5.3. Market Opportunity Analysis |
| 9.North America Adsorbents Market ,2018 - 2022 and Forecast 2023 - 2029 (Sales Value USD Million) |
| 9.1. Type Analysis 2018 - 2022 and Forecast 2023 - 2029 by Sales Value USD Million, Y-o-Y Growth (%), and Market Share (%) |
| 9.1.1.Activated Alumina |
| 9.1.2.Activated Charcoal |
| 9.1.3.Activated Clay |
| 9.1.4.Alumina Silica Gel |
| 9.1.5.Metal Oxides |
| 9.1.6.Polymer Adsorbents |
| 9.1.7.Zeolites |
| 9.1.8.Others |
| 9.2. Application Analysis 2018 - 2022 and Forecast 2023 - 2029 by Sales Value USD Million, Y-o-Y Growth (%), and Market Share (%) |
| 9.2.1.Industrial Gas Purification |
| 9.2.2.Paper/Paper Coatings |
| 9.2.3.Refrigerants |
| 9.2.4.Sulfur Recovery |
| 9.2.5.Transformer Oils |
| 9.2.6.Water Purification |
| 9.2.7.Chemical Removal |
| 9.2.8.Acetylene |
| 9.2.9.Arsenic |
| 9.2.10.Fluoride |
| 9.2.11.Oxygen |
| 9.2.12.Trace |
| 9.3. End User Analysis 2018 - 2022 and Forecast 2023 - 2029 by Sales Value USD Million, Y-o-Y Growth (%), and Market Share (%) |
| 9.3.1.Air Separation |
| 9.3.2.Chemicals/Petrochemicals |
| 9.3.3.Natural Gas |
| 9.3.4.Nuclear Waste Remediation |
| 9.3.5.Oil & Gas Refining |
| 9.3.6.Refrigeration and Air-Conditioning (RAC) Systems |
| 9.3.7.Volatile Organic Compound (VOC) Removal |
| 9.3.8.Water Treatment |
| 9.3.9.Others |
| 9.4. Country Analysis 2018 - 2022 and Forecast 2023 - 2029 by Sales Value USD Million, Y-o-Y Growth (%), and Market Share (%) |
| 9.4.1.United States of America (USA) |
| 9.4.2.Canada |
| 10.Europe Adsorbents Market ,2018 - 2022 and Forecast 2023 - 2029 (Sales Value USD Million) |
| 10.1. Type Analysis and Forecast by Sales Value USD Million, Y-o-Y Growth (%), and Market Share (%) |
| 10.1.1.Activated Alumina |
| 10.1.2.Activated Charcoal |
| 10.1.3.Activated Clay |
| 10.1.4.Alumina Silica Gel |
| 10.1.5.Metal Oxides |
| 10.1.6.Polymer Adsorbents |
| 10.1.7.Zeolites |
| 10.1.8.Others |
| 10.2. Application Analysis 2018 - 2022 and Forecast 2023 - 2029 by Sales Value USD Million, Y-o-Y Growth (%), and Market Share (%) |
| 10.2.1.Industrial Gas Purification |
| 10.2.2.Paper/Paper Coatings |
| 10.2.3.Refrigerants |
| 10.2.4.Sulfur Recovery |
| 10.2.5.Transformer Oils |
| 10.2.6.Water Purification |
| 10.2.7.Chemical Removal |
| 10.2.8.Acetylene |
| 10.2.9.Arsenic |
| 10.2.10.Fluoride |
| 10.2.11.Oxygen |
| 10.2.12.Trace |
| 10.3. End User Analysis 2018 - 2022 and Forecast 2023 - 2029 by Sales Value USD Million, Y-o-Y Growth (%), and Market Share (%) |
| 10.3.1.Air Separation |
| 10.3.2.Chemicals/Petrochemicals |
| 10.3.3.Natural Gas |
| 10.3.4.Nuclear Waste Remediation |
| 10.3.5.Oil & Gas Refining |
| 10.3.6.Refrigeration and Air-Conditioning (RAC) Systems |
| 10.3.7.Volatile Organic Compound (VOC) Removal |
| 10.3.8.Water Treatment |
| 10.3.9.Others |
| 10.4. Country Analysis 2018 - 2022 and Forecast 2023 - 2029 by Sales Value USD Million, Y-o-Y Growth (%), and Market Share (%) |
| 10.4.1.Germany |
| 10.4.2.France |
| 10.4.3.Italy |
| 10.4.4.United Kingdom (UK) |
| 10.4.5.Spain |
| 11.Asia Pacific (APAC) Adsorbents Market ,2018 - 2022 and Forecast 2023 - 2029 (Sales Value USD Million) |
| 11.1. Type Analysis and Forecast by Sales Value USD Million, Y-o-Y Growth (%), and Market Share (%) |
| 11.1.1.Activated Alumina |
| 11.1.2.Activated Charcoal |
| 11.1.3.Activated Clay |
| 11.1.4.Alumina Silica Gel |
| 11.1.5.Metal Oxides |
| 11.1.6.Polymer Adsorbents |
| 11.1.7.Zeolites |
| 11.1.8.Others |
| 11.2. Application Analysis 2018 - 2022 and Forecast 2023 - 2029 by Sales Value USD Million, Y-o-Y Growth (%), and Market Share (%) |
| 11.2.1.Industrial Gas Purification |
| 11.2.2.Paper/Paper Coatings |
| 11.2.3.Refrigerants |
| 11.2.4.Sulfur Recovery |
| 11.2.5.Transformer Oils |
| 11.2.6.Water Purification |
| 11.2.7.Chemical Removal |
| 11.2.8.Acetylene |
| 11.2.9.Arsenic |
| 11.2.10.Fluoride |
| 11.2.11.Oxygen |
| 11.2.12.Trace |
| 11.3. End User Analysis 2018 - 2022 and Forecast 2023 - 2029 by Sales Value USD Million, Y-o-Y Growth (%), and Market Share (%) |
| 11.3.1.Air Separation |
| 11.3.2.Chemicals/Petrochemicals |
| 11.3.3.Natural Gas |
| 11.3.4.Nuclear Waste Remediation |
| 11.3.5.Oil & Gas Refining |
| 11.3.6.Refrigeration and Air-Conditioning (RAC) Systems |
| 11.3.7.Volatile Organic Compound (VOC) Removal |
| 11.3.8.Water Treatment |
| 11.3.9.Others |
| 11.4. Country Analysis 2018 - 2022 and Forecast 2023 - 2029 by Sales Value USD Million, Y-o-Y Growth (%), and Market Share (%) |
| 11.4.1.China |
| 11.4.2.India |
| 11.4.3.Australia and New Zealand (ANZ) |
| 11.4.4.Japan |
| 11.4.5.Rest of APAC |
| 12.Middle East and Africa (MEA) Adsorbents Market ,2018 - 2022 and Forecast 2023 - 2029 (Sales Value USD Million) |
| 12.1. Type Analysis and Forecast by Sales Value USD Million, Y-o-Y Growth (%), and Market Share (%) |
| 12.1.1.Activated Alumina |
| 12.1.2.Activated Charcoal |
| 12.1.3.Activated Clay |
| 12.1.4.Alumina Silica Gel |
| 12.1.5.Metal Oxides |
| 12.1.6.Polymer Adsorbents |
| 12.1.7.Zeolites |
| 12.1.8.Others |
| 12.2. Application Analysis 2018 - 2022 and Forecast 2023 - 2029 by Sales Value USD Million, Y-o-Y Growth (%), and Market Share (%) |
| 12.2.1.Industrial Gas Purification |
| 12.2.2.Paper/Paper Coatings |
| 12.2.3.Refrigerants |
| 12.2.4.Sulfur Recovery |
| 12.2.5.Transformer Oils |
| 12.2.6.Water Purification |
| 12.2.7.Chemical Removal |
| 12.2.8.Acetylene |
| 12.2.9.Arsenic |
| 12.2.10.Fluoride |
| 12.2.11.Oxygen |
| 12.2.12.Trace |
| 12.3. End User Analysis 2018 - 2022 and Forecast 2023 - 2029 by Sales Value USD Million, Y-o-Y Growth (%), and Market Share (%) |
| 12.3.1.Air Separation |
| 12.3.2.Chemicals/Petrochemicals |
| 12.3.3.Natural Gas |
| 12.3.4.Nuclear Waste Remediation |
| 12.3.5.Oil & Gas Refining |
| 12.3.6.Refrigeration and Air-Conditioning (RAC) Systems |
| 12.3.7.Volatile Organic Compound (VOC) Removal |
| 12.3.8.Water Treatment |
| 12.3.9.Others |
| 12.4. Country Analysis 2018 - 2022 and Forecast 2023 - 2029 by Sales Value USD Million, Y-o-Y Growth (%), and Market Share (%) |
| 12.4.1.GCC Countries |
| 12.4.2.South Africa |
| 12.4.3.Rest of MEA |
| 13.Latin America Adsorbents Market ,2018 - 2022 and Forecast 2023 - 2029 (Sales Value USD Million) |
| 13.1. Type Analysis and Forecast by Sales Value USD Million, Y-o-Y Growth (%), and Market Share (%) |
| 13.1.1.Activated Alumina |
| 13.1.2.Activated Charcoal |
| 13.1.3.Activated Clay |
| 13.1.4.Alumina Silica Gel |
| 13.1.5.Metal Oxides |
| 13.1.6.Polymer Adsorbents |
| 13.1.7.Zeolites |
| 13.1.8.Others |
| 13.2. Application Analysis 2018 - 2022 and Forecast 2023 - 2029 by Sales Value USD Million, Y-o-Y Growth (%), and Market Share (%) |
| 13.2.1.Industrial Gas Purification |
| 13.2.2.Paper/Paper Coatings |
| 13.2.3.Refrigerants |
| 13.2.4.Sulfur Recovery |
| 13.2.5.Transformer Oils |
| 13.2.6.Water Purification |
| 13.2.7.Chemical Removal |
| 13.2.8.Acetylene |
| 13.2.9.Arsenic |
| 13.2.10.Fluoride |
| 13.2.11.Oxygen |
| 13.2.12.Trace |
| 13.3. End User Analysis 2018 - 2022 and Forecast 2023 - 2029 by Sales Value USD Million, Y-o-Y Growth (%), and Market Share (%) |
| 13.3.1.Air Separation |
| 13.3.2.Chemicals/Petrochemicals |
| 13.3.3.Natural Gas |
| 13.3.4.Nuclear Waste Remediation |
| 13.3.5.Oil & Gas Refining |
| 13.3.6.Refrigeration and Air-Conditioning (RAC) Systems |
| 13.3.7.Volatile Organic Compound (VOC) Removal |
| 13.3.8.Water Treatment |
| 13.3.9.Others |
| 13.4. Country Analysis 2018 - 2022 and Forecast 2023 - 2029 by Sales Value USD Million, Y-o-Y Growth (%), and Market Share (%) |
| 13.4.1.Brazil |
| 13.4.2.Mexico |
| 13.4.3.Rest of LA |
| 14. Competition Landscape |
| 14.1. Market Player Profiles (Introduction, Brand/Product Sales, Financial Analysis, Product Offerings, Key Developments, Collaborations, M & A, Strategies, and SWOT Analysis) |
| 14.2.1.Arkema S.A (France) |
| 14.2.2.Axens S.A (France) |
| 14.2.3.BASF SE (Germany) |
| 14.2.4.Cabot Corporation (U.S.) |
| 14.2.5.Calgon Carbon Corporation (U.S) |
| 14.2.6.Clariant (Switzerland) |
| 14.2.7.Mitsubishi Chemical Corporation (Japan) |
| 14.2.8.The Dow Chemical Company (U.S) |
| 14.2.9.R Grace and Company (U.S) |
| 14.2.10.Graver Technologies (U.S) |
| 15. Research Methodology |
| 16. Appendix and Abbreviations |
- Arkema S.A (France)
- Axens S.A (France)
- BASF SE (Germany)
- Cabot Corporation (U.S.)
- Calgon Carbon Corporation (U.S)
- Clariant (Switzerland)
- Mitsubishi Chemical Corporation (Japan)
- The Dow Chemical Company (U.S)
- R Grace and Company (U.S)
- Graver Technologies (U.S)
