Green Power Market Size, Share, Growth, Trends, and Industry Analysis: By Energy Source, By Application, By End User and Region Forecast 2021-2032
Green Power Market Size, Share, Growth, Trends, and Industry Analysis: By Energy Source, By Application, By End User and Region Forecast 2021-2032
Report ID:809625
Published Date:Nov 2025
No of Pages: 230
Format:

Green Power Market size was valued at US$ 57,469.2 million in 2025 and is expected to reach US$ 127,842.2 million by 2032, growing at a significant CAGR of 12.1% from 2026-2032. Green power is the electrical energy produced from various eco-friendly and renewable sources such as wind, solar, geothermal, and hydropower. The increasing awareness of eco-friendly renewable energy among the population, and growing government campaigns and initiatives in various countries to support the green environment and enhance green power sources availability is expected to increase the demand for green power and drive the growth of the market over the significant rate.
For instance, the Indian government is providing subsidies to setup residential solar panels. In addition, the cost of green energy is low compared to conventional energy sources, and the capability of green energy to replace fossil fuel in the future is expected to boost the market growth over the forecast years. Furthermore, various government bodies across the globe are shifting to renewable energy sources like wind, solar, and hydropower by replacing them with conventional electricity sources. For instance, the Indian government has taken advantage of community choice aggregation policies, which permit government bodies across the globe to procure renewable energy resources on behalf of their constituents while retaining their existing electricity provider for transmission and distribution services, and increasing investments in renewable energy sources in countries like India, China is expected to trigger the market growth in the Asia Pacific region over the forecast years.
However, factors like huge initial investments in the setup of renewable energy sources, procurement, and monitoring of acceptable solar sites to determine whether they are suitable or not, and training of personnel to install operate, and maintain advanced technologies are expected to hamper the growth of market over the forecast years.
Study Period
2026-2032Base Year
2025CAGR
12.1%Largest Market
Asia-PacificFastest Growing Market
North-America
The green power market is expected to grow over the forecast period due to the increasing environmental consciousness among the public to reduce carbon footprints and the low energy cost of renewable energy. Various initiatives and campaigns in reducing carbon footprint in the environment are conducted by the government in many emerging countries like India, China, USA, and other Middle east countries. For instance, Indian government is providing subsidies for the residential and industrial setup of solar panels. The renewable energy releases zero emission of carbon in environment. the green energy not only reduces the carbon foot prints in environment but also helps in preservation of natural resources.
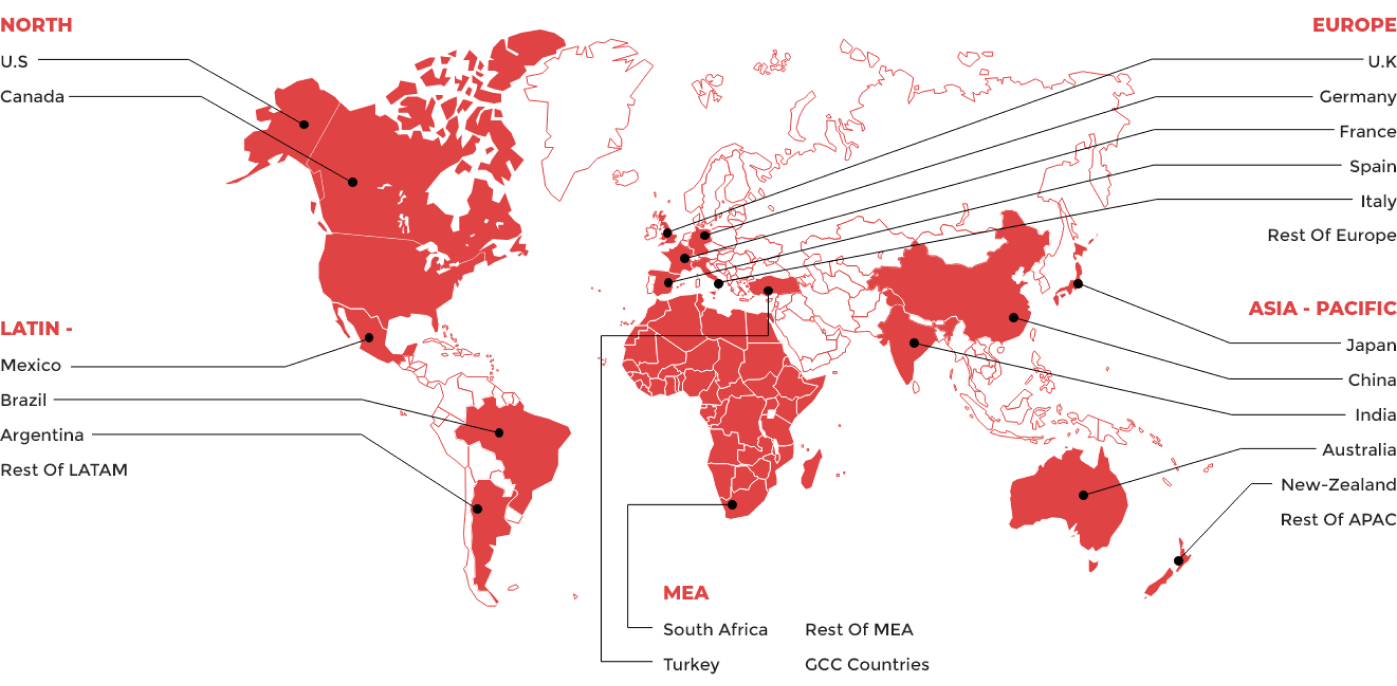
The green power market is segmented based on regions into North America, Asia-pacific, Europe, Latin America and Middle East and Africa. Asia Pacific green power market is likely to hold a significant revenue share, and in the forecast years, it is predicted to increase rapidly due to the rapid industrialization, and government initiatives. Countries like India and China is focusing on reducing the fossil fuel dependency by replacing it with renewable energy. North America region is expected to have significant growth over the forecast years due to increasing in infrastructures in countries like USA and Canada. Europe region is anticipated to install 105GW of new wind energy capacity over the forecast years.

Latin America

Europe

Asia Pacific

Middle East

North America
|
Report Benchmarks |
Details |
|
Report Study Period |
2026-2032 |
|
Market CAGR |
12.1% |
|
By Energy Source |
|
|
By Application |
|
|
By End User |
|
|
By Region |
|
Download Free Sample Report
![]()
The green power market size was valued at US$ 57,469.2 million in 2025 and is expected to reach US$ 127,842.2 million by 2032, growing at a significant CAGR of 12.1% from 2026-2032.
The leading players in the global green power market are Trina Solar, Adani Green Energy Ltd, Canadian Solar, Tata Power Solar Systems Limited, Innergex, Enel Green Power, Xcel Energy, Acciona, Upwind Solutions, Sinovel Wind Group Co Ltd., Geronimo Energy.
Asia Pacific region is expected to have a larger market share value due to its increased population and increasing demand for electricity and increasing industrialization over the forecast period.
Content Updated Date: Mar 2026
| 1. Executive Summary |
| 2. Global Green Power Market Introduction |
| 2.1.Global Green Power Market - Taxonomy |
| 2.2.Global Green Power Market - Definitions |
| 2.2.1.Energy Source |
| 2.2.2.Application |
| 2.2.3.End Users |
| 2.2.4.Geography |
| 2.2.5.Region |
| 3. Global Green Power Market Dynamics |
| 3.1. Drivers |
| 3.2. Restraints |
| 3.3. Opportunities/Unmet Needs of the Market |
| 3.4. Trends |
| 3.5. Product Landscape |
| 3.6. New Product Launches |
| 3.7. Impact of COVID 19 on Market |
| 4. Global Green Power Market Analysis, 2021 - 2025 and Forecast 2026 - 2032 |
| 4.1. Market Analysis, 2021 - 2025 and Forecast 2026 - 2032, (Sales Value USD Million) |
| 4.2. Year-Over-Year (Y-o-Y) Growth Analysis (%) |
| 4.3. Market Opportunity Analysis |
| 5. Global Green Power Market By Energy Source, 2021 - 2025 and Forecast 2026 - 2032 (Sales Value USD Million) |
| 5.1. Solar Energy |
| 5.1.1. Market Analysis, 2021 - 2025 and Forecast 2026 - 2032, (Sales Value USD Million) |
| 5.1.2. Year-Over-Year (Y-o-Y) Growth Analysis (%) and Market Share Analysis (%) |
| 5.1.3. Market Opportunity Analysis |
| 5.2. Wind Energy |
| 5.2.1. Market Analysis, 2021 - 2025 and Forecast 2026 - 2032, (Sales Value USD Million) |
| 5.2.2. Year-Over-Year (Y-o-Y) Growth Analysis (%) and Market Share Analysis (%) |
| 5.2.3. Market Opportunity Analysis |
| 5.3. Geothermal Energy |
| 5.3.1. Market Analysis, 2021 - 2025 and Forecast 2026 - 2032, (Sales Value USD Million) |
| 5.3.2. Year-Over-Year (Y-o-Y) Growth Analysis (%) and Market Share Analysis (%) |
| 5.3.3. Market Opportunity Analysis |
| 5.4. Hydroelectric power |
| 5.4.1. Market Analysis, 2021 - 2025 and Forecast 2026 - 2032, (Sales Value USD Million) |
| 5.4.2. Year-Over-Year (Y-o-Y) Growth Analysis (%) and Market Share Analysis (%) |
| 5.4.3. Market Opportunity Analysis |
| 5.5. Bioenergy |
| 5.5.1. Market Analysis, 2021 - 2025 and Forecast 2026 - 2032, (Sales Value USD Million) |
| 5.5.2. Year-Over-Year (Y-o-Y) Growth Analysis (%) and Market Share Analysis (%) |
| 5.5.3. Market Opportunity Analysis |
| 5.6. Others |
| 5.6.1. Market Analysis, 2021 - 2025 and Forecast 2026 - 2032, (Sales Value USD Million) |
| 5.6.2. Year-Over-Year (Y-o-Y) Growth Analysis (%) and Market Share Analysis (%) |
| 5.6.3. Market Opportunity Analysis |
| 6. Global Green Power Market By Application, 2021 - 2025 and Forecast 2026 - 2032 (Sales Value USD Million) |
| 6.1. Electricity generation |
| 6.1.1. Market Analysis, 2021 - 2025 and Forecast 2026 - 2032, (Sales Value USD Million) |
| 6.1.2. Year-Over-Year (Y-o-Y) Growth Analysis (%) and Market Share Analysis (%) |
| 6.1.3. Market Opportunity Analysis |
| 6.2. Transportation |
| 6.2.1. Market Analysis, 2021 - 2025 and Forecast 2026 - 2032, (Sales Value USD Million) |
| 6.2.2. Year-Over-Year (Y-o-Y) Growth Analysis (%) and Market Share Analysis (%) |
| 6.2.3. Market Opportunity Analysis |
| 6.3. Heating |
| 6.3.1. Market Analysis, 2021 - 2025 and Forecast 2026 - 2032, (Sales Value USD Million) |
| 6.3.2. Year-Over-Year (Y-o-Y) Growth Analysis (%) and Market Share Analysis (%) |
| 6.3.3. Market Opportunity Analysis |
| 6.4. Others |
| 6.4.1. Market Analysis, 2021 - 2025 and Forecast 2026 - 2032, (Sales Value USD Million) |
| 6.4.2. Year-Over-Year (Y-o-Y) Growth Analysis (%) and Market Share Analysis (%) |
| 6.4.3. Market Opportunity Analysis |
| 7. Global Green Power Market By End Users, 2021 - 2025 and Forecast 2026 - 2032 (Sales Value USD Million) |
| 7.1. Residential |
| 7.1.1. Market Analysis, 2021 - 2025 and Forecast 2026 - 2032, (Sales Value USD Million) |
| 7.1.2. Year-Over-Year (Y-o-Y) Growth Analysis (%) and Market Share Analysis (%) |
| 7.1.3. Market Opportunity Analysis |
| 7.2. Commercial |
| 7.2.1. Market Analysis, 2021 - 2025 and Forecast 2026 - 2032, (Sales Value USD Million) |
| 7.2.2. Year-Over-Year (Y-o-Y) Growth Analysis (%) and Market Share Analysis (%) |
| 7.2.3. Market Opportunity Analysis |
| 7.3. Industrial |
| 7.3.1. Market Analysis, 2021 - 2025 and Forecast 2026 - 2032, (Sales Value USD Million) |
| 7.3.2. Year-Over-Year (Y-o-Y) Growth Analysis (%) and Market Share Analysis (%) |
| 7.3.3. Market Opportunity Analysis |
| 7.4. Utility |
| 7.4.1. Market Analysis, 2021 - 2025 and Forecast 2026 - 2032, (Sales Value USD Million) |
| 7.4.2. Year-Over-Year (Y-o-Y) Growth Analysis (%) and Market Share Analysis (%) |
| 7.4.3. Market Opportunity Analysis |
| 8. Global Green Power Market By Geography, 2021 - 2025 and Forecast 2026 - 2032 (Sales Value USD Million) |
| 8.1. North America |
| 8.1.1. Market Analysis, 2021 - 2025 and Forecast 2026 - 2032, (Sales Value USD Million) |
| 8.1.2. Year-Over-Year (Y-o-Y) Growth Analysis (%) and Market Share Analysis (%) |
| 8.1.3. Market Opportunity Analysis |
| 8.2. Europe |
| 8.2.1. Market Analysis, 2021 - 2025 and Forecast 2026 - 2032, (Sales Value USD Million) |
| 8.2.2. Year-Over-Year (Y-o-Y) Growth Analysis (%) and Market Share Analysis (%) |
| 8.2.3. Market Opportunity Analysis |
| 8.3. The Asia Pacific |
| 8.3.1. Market Analysis, 2021 - 2025 and Forecast 2026 - 2032, (Sales Value USD Million) |
| 8.3.2. Year-Over-Year (Y-o-Y) Growth Analysis (%) and Market Share Analysis (%) |
| 8.3.3. Market Opportunity Analysis |
| 8.4. Latin America |
| 8.4.1. Market Analysis, 2021 - 2025 and Forecast 2026 - 2032, (Sales Value USD Million) |
| 8.4.2. Year-Over-Year (Y-o-Y) Growth Analysis (%) and Market Share Analysis (%) |
| 8.4.3. Market Opportunity Analysis |
| 8.5. MEA |
| 8.5.1. Market Analysis, 2021 - 2025 and Forecast 2026 - 2032, (Sales Value USD Million) |
| 8.5.2. Year-Over-Year (Y-o-Y) Growth Analysis (%) and Market Share Analysis (%) |
| 8.5.3. Market Opportunity Analysis |
| 9. Global Green Power Market By Region, 2021 - 2025 and Forecast 2026 - 2032 (Sales Value USD Million) |
| 9.1. North America |
| 9.1.1. Market Analysis, 2021 - 2025 and Forecast 2026 - 2032, (Sales Value USD Million) |
| 9.1.2. Year-Over-Year (Y-o-Y) Growth Analysis (%) and Market Share Analysis (%) |
| 9.1.3. Market Opportunity Analysis |
| 9.2. Europe |
| 9.2.1. Market Analysis, 2021 - 2025 and Forecast 2026 - 2032, (Sales Value USD Million) |
| 9.2.2. Year-Over-Year (Y-o-Y) Growth Analysis (%) and Market Share Analysis (%) |
| 9.2.3. Market Opportunity Analysis |
| 9.3. Asia Pacific (APAC) |
| 9.3.1. Market Analysis, 2021 - 2025 and Forecast 2026 - 2032, (Sales Value USD Million) |
| 9.3.2. Year-Over-Year (Y-o-Y) Growth Analysis (%) and Market Share Analysis (%) |
| 9.3.3. Market Opportunity Analysis |
| 9.4. Middle East and Africa (MEA) |
| 9.4.1. Market Analysis, 2021 - 2025 and Forecast 2026 - 2032, (Sales Value USD Million) |
| 9.4.2. Year-Over-Year (Y-o-Y) Growth Analysis (%) and Market Share Analysis (%) |
| 9.4.3. Market Opportunity Analysis |
| 9.5. Latin America |
| 9.5.1. Market Analysis, 2021 - 2025 and Forecast 2026 - 2032, (Sales Value USD Million) |
| 9.5.2. Year-Over-Year (Y-o-Y) Growth Analysis (%) and Market Share Analysis (%) |
| 9.5.3. Market Opportunity Analysis |
| 10. North America Green Power Market ,2021 - 2025 and Forecast 2026 - 2032 (Sales Value USD Million) |
| 10.1. Energy Source Analysis 2021 - 2025 and Forecast 2026 - 2032 by Sales Value USD Million, Y-o-Y Growth (%), and Market Share (%) |
| 10.1.1.Solar Energy |
| 10.1.2.Wind Energy |
| 10.1.3.Geothermal Energy |
| 10.1.4.Hydroelectric power |
| 10.1.5.Bioenergy |
| 10.1.6.Others |
| 10.2. Application Analysis 2021 - 2025 and Forecast 2026 - 2032 by Sales Value USD Million, Y-o-Y Growth (%), and Market Share (%) |
| 10.2.1.Electricity generation |
| 10.2.2.Transportation |
| 10.2.3.Heating |
| 10.2.4.Others |
| 10.3. End Users Analysis 2021 - 2025 and Forecast 2026 - 2032 by Sales Value USD Million, Y-o-Y Growth (%), and Market Share (%) |
| 10.3.1.Residential |
| 10.3.2.Commercial |
| 10.3.3.Industrial |
| 10.3.4.Utility |
| 10.4. Geography Analysis 2021 - 2025 and Forecast 2026 - 2032 by Sales Value USD Million, Y-o-Y Growth (%), and Market Share (%) |
| 10.4.1.North America |
| 10.4.2.Europe |
| 10.4.3.The Asia Pacific |
| 10.4.4.Latin America |
| 10.4.5.MEA |
| 10.5. Country Analysis 2021 - 2025 and Forecast 2026 - 2032 by Sales Value USD Million, Y-o-Y Growth (%), and Market Share (%) |
| 10.5.1.United States of America (USA) |
| 10.5.2.Canada |
| 11. Europe Green Power Market ,2021 - 2025 and Forecast 2026 - 2032 (Sales Value USD Million) |
| 11.1. Energy Source Analysis and Forecast by Sales Value USD Million, Y-o-Y Growth (%), and Market Share (%) |
| 11.1.1.Solar Energy |
| 11.1.2.Wind Energy |
| 11.1.3.Geothermal Energy |
| 11.1.4.Hydroelectric power |
| 11.1.5.Bioenergy |
| 11.1.6.Others |
| 11.2. Application Analysis 2021 - 2025 and Forecast 2026 - 2032 by Sales Value USD Million, Y-o-Y Growth (%), and Market Share (%) |
| 11.2.1.Electricity generation |
| 11.2.2.Transportation |
| 11.2.3.Heating |
| 11.2.4.Others |
| 11.3. End Users Analysis 2021 - 2025 and Forecast 2026 - 2032 by Sales Value USD Million, Y-o-Y Growth (%), and Market Share (%) |
| 11.3.1.Residential |
| 11.3.2.Commercial |
| 11.3.3.Industrial |
| 11.3.4.Utility |
| 11.4. Geography Analysis 2021 - 2025 and Forecast 2026 - 2032 by Sales Value USD Million, Y-o-Y Growth (%), and Market Share (%) |
| 11.4.1.North America |
| 11.4.2.Europe |
| 11.4.3.The Asia Pacific |
| 11.4.4.Latin America |
| 11.4.5.MEA |
| 11.5. Country Analysis 2021 - 2025 and Forecast 2026 - 2032 by Sales Value USD Million, Y-o-Y Growth (%), and Market Share (%) |
| 11.5.1.Germany |
| 11.5.2.France |
| 11.5.3.Italy |
| 11.5.4.United Kingdom (UK) |
| 11.5.5.Spain |
| 11.5.6.Rest of EU |
| 12. Asia Pacific (APAC) Green Power Market ,2021 - 2025 and Forecast 2026 - 2032 (Sales Value USD Million) |
| 12.1. Energy Source Analysis and Forecast by Sales Value USD Million, Y-o-Y Growth (%), and Market Share (%) |
| 12.1.1.Solar Energy |
| 12.1.2.Wind Energy |
| 12.1.3.Geothermal Energy |
| 12.1.4.Hydroelectric power |
| 12.1.5.Bioenergy |
| 12.1.6.Others |
| 12.2. Application Analysis 2021 - 2025 and Forecast 2026 - 2032 by Sales Value USD Million, Y-o-Y Growth (%), and Market Share (%) |
| 12.2.1.Electricity generation |
| 12.2.2.Transportation |
| 12.2.3.Heating |
| 12.2.4.Others |
| 12.3. End Users Analysis 2021 - 2025 and Forecast 2026 - 2032 by Sales Value USD Million, Y-o-Y Growth (%), and Market Share (%) |
| 12.3.1.Residential |
| 12.3.2.Commercial |
| 12.3.3.Industrial |
| 12.3.4.Utility |
| 12.4. Geography Analysis 2021 - 2025 and Forecast 2026 - 2032 by Sales Value USD Million, Y-o-Y Growth (%), and Market Share (%) |
| 12.4.1.North America |
| 12.4.2.Europe |
| 12.4.3.The Asia Pacific |
| 12.4.4.Latin America |
| 12.4.5.MEA |
| 12.5. Country Analysis 2021 - 2025 and Forecast 2026 - 2032 by Sales Value USD Million, Y-o-Y Growth (%), and Market Share (%) |
| 12.5.1.China |
| 12.5.2.India |
| 12.5.3.Australia and New Zealand (ANZ) |
| 12.5.4.Japan |
| 12.5.5.Rest of APAC |
| 13. Middle East and Africa (MEA) Green Power Market ,2021 - 2025 and Forecast 2026 - 2032 (Sales Value USD Million) |
| 13.1. Energy Source Analysis and Forecast by Sales Value USD Million, Y-o-Y Growth (%), and Market Share (%) |
| 13.1.1.Solar Energy |
| 13.1.2.Wind Energy |
| 13.1.3.Geothermal Energy |
| 13.1.4.Hydroelectric power |
| 13.1.5.Bioenergy |
| 13.1.6.Others |
| 13.2. Application Analysis 2021 - 2025 and Forecast 2026 - 2032 by Sales Value USD Million, Y-o-Y Growth (%), and Market Share (%) |
| 13.2.1.Electricity generation |
| 13.2.2.Transportation |
| 13.2.3.Heating |
| 13.2.4.Others |
| 13.3. End Users Analysis 2021 - 2025 and Forecast 2026 - 2032 by Sales Value USD Million, Y-o-Y Growth (%), and Market Share (%) |
| 13.3.1.Residential |
| 13.3.2.Commercial |
| 13.3.3.Industrial |
| 13.3.4.Utility |
| 13.4. Geography Analysis 2021 - 2025 and Forecast 2026 - 2032 by Sales Value USD Million, Y-o-Y Growth (%), and Market Share (%) |
| 13.4.1.North America |
| 13.4.2.Europe |
| 13.4.3.The Asia Pacific |
| 13.4.4.Latin America |
| 13.4.5.MEA |
| 13.5. Country Analysis 2021 - 2025 and Forecast 2026 - 2032 by Sales Value USD Million, Y-o-Y Growth (%), and Market Share (%) |
| 13.5.1.GCC Countries |
| 13.5.2.South Africa |
| 13.5.3.Rest of MEA |
| 14. Latin America Green Power Market ,2021 - 2025 and Forecast 2026 - 2032 (Sales Value USD Million) |
| 14.1. Energy Source Analysis and Forecast by Sales Value USD Million, Y-o-Y Growth (%), and Market Share (%) |
| 14.1.1.Solar Energy |
| 14.1.2.Wind Energy |
| 14.1.3.Geothermal Energy |
| 14.1.4.Hydroelectric power |
| 14.1.5.Bioenergy |
| 14.1.6.Others |
| 14.2. Application Analysis 2021 - 2025 and Forecast 2026 - 2032 by Sales Value USD Million, Y-o-Y Growth (%), and Market Share (%) |
| 14.2.1.Electricity generation |
| 14.2.2.Transportation |
| 14.2.3.Heating |
| 14.2.4.Others |
| 14.3. End Users Analysis 2021 - 2025 and Forecast 2026 - 2032 by Sales Value USD Million, Y-o-Y Growth (%), and Market Share (%) |
| 14.3.1.Residential |
| 14.3.2.Commercial |
| 14.3.3.Industrial |
| 14.3.4.Utility |
| 14.4. Geography Analysis 2021 - 2025 and Forecast 2026 - 2032 by Sales Value USD Million, Y-o-Y Growth (%), and Market Share (%) |
| 14.4.1.North America |
| 14.4.2.Europe |
| 14.4.3.The Asia Pacific |
| 14.4.4.Latin America |
| 14.4.5.MEA |
| 14.5. Country Analysis 2021 - 2025 and Forecast 2026 - 2032 by Sales Value USD Million, Y-o-Y Growth (%), and Market Share (%) |
| 14.5.1.Brazil |
| 14.5.2.Mexico |
| 14.5.3.Rest of LA |
| 15. Competition Landscape |
| 15.1. Market Player Profiles (Introduction, Brand/Product Sales, Financial Analysis, Product Offerings, Key Developments, Collaborations, M & A, Strategies, and SWOT Analysis) |
| 15.2.1.Trina Solar |
| 15.2.2.Adani Green Energy Ltd |
| 15.2.3.Canadian Solar |
| 15.2.4.Tata Power Solar Systems Limited |
| 15.2.5.Innergex |
| 15.2.6.Enel Green Power |
| 15.2.7.Xcel Energy |
| 15.2.8.Acciona |
| 15.2.9.Upwind Solutions |
| 15.2.10.Sinovel Wind Group Co Ltd. |
| 15.2.11.Geronimo Energy |
| 16. Research Methodology |
| 17. Appendix and Abbreviations |
Key Market Players

 Download Sample


