- Ibuprofen
- Aspirin
- Paracetamol
- Diclofenac
- Others
Non-steroidal Anti-inflammatory Drugs (NSAIDs) Market size was valued at USD 2,603 million in 2022 and is poised to grow at a significant CAGR of 0.8% from 2023-2029. Patients with chronic inflammatory arthritis frequently take nonsteroidal anti-inflammatory drugs (NSAIDs). The market for NSAIDs is expected to grow faster as the incidence of arthritis rises. Because of their ability to block prostaglandin formation at the level of the cyclooxygenase enzyme, they are powerful anti-inflammatory and analgesic. In January 2021, NSAIDs have several medications on the market, with many more in the works. Celebrex, an oral drug intended to treat inflammation and discomfort caused by ankylosing spondylitis and other illnesses, was approved by the US Food and Drug Administration. Osteoarthritis, rheumatoid arthritis, juvenile arthritis, acute pain, and primary dysmenorrhea are among the conditions for which the generic medication is prescribed.
Non-steroidal Anti-inflammatory Drugs (NSAIDs) Market Key Developments:
- In May 2019, according to Perrigo Company plc, the FDA has approved an Abbreviated New Drug Application (ANDA) for Voltaren Gel.
- In April 2018: The USFDA authorized Strides Shasun's generic Ibuprofen capsules, 200 mg. They are intended to alleviate pain. Pfizer Inc.'s Advil Liqui-Gels 200 mg is a generic version.
Nsaids Market Summary
Study Period
2024-2030
Base Year
2023
CAGR
0.8%
Largest Market
Asia-Pacific
Fastest Growing Market
North-America
NSAIDs Market Dynamics
One of the major reasons driving market expansion is the rising prevalence of pain and inflammation-causing disorders. The use of these medications to treat acute and chronic pain is gradually increasing. Ibuprofen and diclofenac are two of the most widely recommended pain relievers. The governments of several countries are working to lower the cost of detecting and treating chronic pain. NSAIDs, on the other hand, can induce dizziness, stomach problems, ulcers, and allergic reactions, among other things. It can suffocate market growth.
Key Features of the Reports
- The report provides granular level information about the market size, regional market share, historic market (2019-2023), and forecast (2024-2030)
- The report covers in-detail insights about the competitor’s overview, company share analysis, key market developments, and their key strategies
- The report outlines drivers, restraints, unmet needs, and trends that are currently affecting the market
- The report tracks recent innovations, key developments, and start-up details that are actively working in the market
- The report provides a plethora of information about market entry strategies, regulatory framework, and reimbursement scenario

Nsaids Market Segmentation
By Molecule Type
By Formulation
- Tablets
- Capsules
- Suspension
- Topical Preparations
- Others
By Geography
- North America
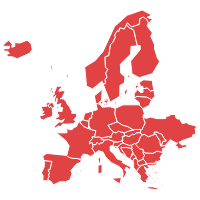
- Europe
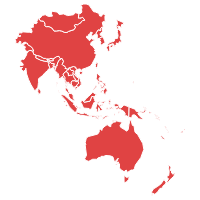
- Asia Pacific
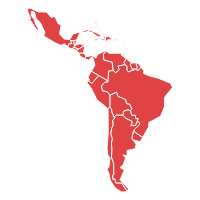
- Latin America
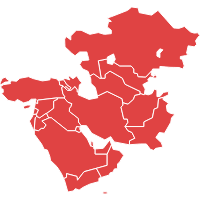
- MEA
Frequently Asked Questions
The nsaids market size was valued at USD 2,603 million in 2022
The nsaids market key players are: Pfizer Inc. GlaxoSmithKline plc Boehringer Ingelheim International GmbH Johnson & Johnson Services, Inc. Bayer AG AstraZeneca Zyla Life Sciences Horizon Therapeutics plc
The nsaids market has been classified into North America, Asia Pacific, Europe, Latin America, Middle East and Africa, and the rest of MEA.
| 1. Executive Summary |
| 2. Global Non-steroidal Anti-inflammatory Drugs (NSAIDs) Market Introduction |
| 2.1.Global Non-steroidal Anti-inflammatory Drugs (NSAIDs) Market - Taxonomy |
| 2.2.Global Non-steroidal Anti-inflammatory Drugs (NSAIDs) Market - Definitions |
| 2.2.1.Molecule Type |
| 2.2.2.Formulation |
| 2.2.3.Geography |
| 2.2.4.Region |
| 3. Global Non-steroidal Anti-inflammatory Drugs (NSAIDs) Market Dynamics |
| 3.1. Drivers |
| 3.2. Restraints |
| 3.3. Opportunities/Unmet Needs of the Market |
| 3.4. Trends |
| 3.5. Product Landscape |
| 3.6. New Product Launches |
| 3.7. Impact of COVID 19 on Market |
| 4. Global Non-steroidal Anti-inflammatory Drugs (NSAIDs) Market Analysis, 2018 - 2022 and Forecast 2023 - 2029 |
| 4.1. Market Analysis, 2018 - 2022 and Forecast, 2023 - 2029, (Sales Value USD Million) |
| 4.2. Year-Over-Year (Y-o-Y) Growth Analysis (%) |
| 4.3. Market Opportunity Analysis |
| 5. Global Non-steroidal Anti-inflammatory Drugs (NSAIDs) Market By Molecule Type, 2018 - 2022 and Forecast 2023 - 2029 (Sales Value USD Million) |
| 5.1. Ibuprofen |
| 5.1.1. Market Analysis, 2018 - 2022 and Forecast, 2023 - 2029, (Sales Value USD Million) |
| 5.1.2. Year-Over-Year (Y-o-Y) Growth Analysis (%) and Market Share Analysis (%) |
| 5.1.3. Market Opportunity Analysis |
| 5.2. Aspirin |
| 5.2.1. Market Analysis, 2018 - 2022 and Forecast, 2023 - 2029, (Sales Value USD Million) |
| 5.2.2. Year-Over-Year (Y-o-Y) Growth Analysis (%) and Market Share Analysis (%) |
| 5.2.3. Market Opportunity Analysis |
| 5.3. Paracetamol |
| 5.3.1. Market Analysis, 2018 - 2022 and Forecast, 2023 - 2029, (Sales Value USD Million) |
| 5.3.2. Year-Over-Year (Y-o-Y) Growth Analysis (%) and Market Share Analysis (%) |
| 5.3.3. Market Opportunity Analysis |
| 5.4. Diclofenac |
| 5.4.1. Market Analysis, 2018 - 2022 and Forecast, 2023 - 2029, (Sales Value USD Million) |
| 5.4.2. Year-Over-Year (Y-o-Y) Growth Analysis (%) and Market Share Analysis (%) |
| 5.4.3. Market Opportunity Analysis |
| 5.5. Others |
| 5.5.1. Market Analysis, 2018 - 2022 and Forecast, 2023 - 2029, (Sales Value USD Million) |
| 5.5.2. Year-Over-Year (Y-o-Y) Growth Analysis (%) and Market Share Analysis (%) |
| 5.5.3. Market Opportunity Analysis |
| 6. Global Non-steroidal Anti-inflammatory Drugs (NSAIDs) Market By Formulation, 2018 - 2022 and Forecast 2023 - 2029 (Sales Value USD Million) |
| 6.1. Tablets |
| 6.1.1. Market Analysis, 2018 - 2022 and Forecast, 2023 - 2029, (Sales Value USD Million) |
| 6.1.2. Year-Over-Year (Y-o-Y) Growth Analysis (%) and Market Share Analysis (%) |
| 6.1.3. Market Opportunity Analysis |
| 6.2. Capsules |
| 6.2.1. Market Analysis, 2018 - 2022 and Forecast, 2023 - 2029, (Sales Value USD Million) |
| 6.2.2. Year-Over-Year (Y-o-Y) Growth Analysis (%) and Market Share Analysis (%) |
| 6.2.3. Market Opportunity Analysis |
| 6.3. Suspension |
| 6.3.1. Market Analysis, 2018 - 2022 and Forecast, 2023 - 2029, (Sales Value USD Million) |
| 6.3.2. Year-Over-Year (Y-o-Y) Growth Analysis (%) and Market Share Analysis (%) |
| 6.3.3. Market Opportunity Analysis |
| 6.4. Topical Preparations |
| 6.4.1. Market Analysis, 2018 - 2022 and Forecast, 2023 - 2029, (Sales Value USD Million) |
| 6.4.2. Year-Over-Year (Y-o-Y) Growth Analysis (%) and Market Share Analysis (%) |
| 6.4.3. Market Opportunity Analysis |
| 6.5. Others |
| 6.5.1. Market Analysis, 2018 - 2022 and Forecast, 2023 - 2029, (Sales Value USD Million) |
| 6.5.2. Year-Over-Year (Y-o-Y) Growth Analysis (%) and Market Share Analysis (%) |
| 6.5.3. Market Opportunity Analysis |
| 7. Global Non-steroidal Anti-inflammatory Drugs (NSAIDs) Market By Geography, 2018 - 2022 and Forecast 2023 - 2029 (Sales Value USD Million) |
| 7.1. North America |
| 7.1.1. Market Analysis, 2018 - 2022 and Forecast, 2023 - 2029, (Sales Value USD Million) |
| 7.1.2. Year-Over-Year (Y-o-Y) Growth Analysis (%) and Market Share Analysis (%) |
| 7.1.3. Market Opportunity Analysis |
| 7.2. Europe |
| 7.2.1. Market Analysis, 2018 - 2022 and Forecast, 2023 - 2029, (Sales Value USD Million) |
| 7.2.2. Year-Over-Year (Y-o-Y) Growth Analysis (%) and Market Share Analysis (%) |
| 7.2.3. Market Opportunity Analysis |
| 7.3. Asia Pacific |
| 7.3.1. Market Analysis, 2018 - 2022 and Forecast, 2023 - 2029, (Sales Value USD Million) |
| 7.3.2. Year-Over-Year (Y-o-Y) Growth Analysis (%) and Market Share Analysis (%) |
| 7.3.3. Market Opportunity Analysis |
| 7.4. Latin America |
| 7.4.1. Market Analysis, 2018 - 2022 and Forecast, 2023 - 2029, (Sales Value USD Million) |
| 7.4.2. Year-Over-Year (Y-o-Y) Growth Analysis (%) and Market Share Analysis (%) |
| 7.4.3. Market Opportunity Analysis |
| 7.5. MEA |
| 7.5.1. Market Analysis, 2018 - 2022 and Forecast, 2023 - 2029, (Sales Value USD Million) |
| 7.5.2. Year-Over-Year (Y-o-Y) Growth Analysis (%) and Market Share Analysis (%) |
| 7.5.3. Market Opportunity Analysis |
| 8. Global Non-steroidal Anti-inflammatory Drugs (NSAIDs) Market By Region, 2018 - 2022 and Forecast 2023 - 2029 (Sales Value USD Million) |
| 8.1. North America |
| 8.1.1. Market Analysis, 2018 - 2022 and Forecast, 2023 - 2029, (Sales Value USD Million) |
| 8.1.2. Year-Over-Year (Y-o-Y) Growth Analysis (%) and Market Share Analysis (%) |
| 8.1.3. Market Opportunity Analysis |
| 8.2. Europe |
| 8.2.1. Market Analysis, 2018 - 2022 and Forecast, 2023 - 2029, (Sales Value USD Million) |
| 8.2.2. Year-Over-Year (Y-o-Y) Growth Analysis (%) and Market Share Analysis (%) |
| 8.2.3. Market Opportunity Analysis |
| 8.3. Asia Pacific (APAC) |
| 8.3.1. Market Analysis, 2018 - 2022 and Forecast, 2023 - 2029, (Sales Value USD Million) |
| 8.3.2. Year-Over-Year (Y-o-Y) Growth Analysis (%) and Market Share Analysis (%) |
| 8.3.3. Market Opportunity Analysis |
| 8.4. Middle East and Africa (MEA) |
| 8.4.1. Market Analysis, 2018 - 2022 and Forecast, 2023 - 2029, (Sales Value USD Million) |
| 8.4.2. Year-Over-Year (Y-o-Y) Growth Analysis (%) and Market Share Analysis (%) |
| 8.4.3. Market Opportunity Analysis |
| 8.5. Latin America |
| 8.5.1. Market Analysis, 2018 - 2022 and Forecast, 2023 - 2029, (Sales Value USD Million) |
| 8.5.2. Year-Over-Year (Y-o-Y) Growth Analysis (%) and Market Share Analysis (%) |
| 8.5.3. Market Opportunity Analysis |
| 9. North America Non-steroidal Anti-inflammatory Drugs (NSAIDs) Market ,2018 - 2022 and Forecast 2023 - 2029 (Sales Value USD Million) |
| 9.1. Molecule Type Analysis 2018 - 2022 and Forecast 2023 - 2029 by Sales Value USD Million, Y-o-Y Growth (%), and Market Share (%) |
| 9.1.1.Ibuprofen |
| 9.1.2.Aspirin |
| 9.1.3.Paracetamol |
| 9.1.4.Diclofenac |
| 9.1.5.Others |
| 9.2. Formulation Analysis 2018 - 2022 and Forecast 2023 - 2029 by Sales Value USD Million, Y-o-Y Growth (%), and Market Share (%) |
| 9.2.1.Tablets |
| 9.2.2.Capsules |
| 9.2.3.Suspension |
| 9.2.4.Topical Preparations |
| 9.2.5.Others |
| 9.3. Geography Analysis 2018 - 2022 and Forecast 2023 - 2029 by Sales Value USD Million, Y-o-Y Growth (%), and Market Share (%) |
| 9.3.1.North America |
| 9.3.2.Europe |
| 9.3.3.Asia Pacific |
| 9.3.4.Latin America |
| 9.3.5.MEA |
| 9.4. Country Analysis 2018 - 2022 and Forecast 2023 - 2029 by Sales Value USD Million, Y-o-Y Growth (%), and Market Share (%) |
| 9.4.1.United States of America (USA) |
| 9.4.2.Canada |
| 10. Europe Non-steroidal Anti-inflammatory Drugs (NSAIDs) Market ,2018 - 2022 and Forecast 2023 - 2029 (Sales Value USD Million) |
| 10.1. Molecule Type Analysis and Forecast by Sales Value USD Million, Y-o-Y Growth (%), and Market Share (%) |
| 10.1.1.Ibuprofen |
| 10.1.2.Aspirin |
| 10.1.3.Paracetamol |
| 10.1.4.Diclofenac |
| 10.1.5.Others |
| 10.2. Formulation Analysis 2018 - 2022 and Forecast 2023 - 2029 by Sales Value USD Million, Y-o-Y Growth (%), and Market Share (%) |
| 10.2.1.Tablets |
| 10.2.2.Capsules |
| 10.2.3.Suspension |
| 10.2.4.Topical Preparations |
| 10.2.5.Others |
| 10.3. Geography Analysis 2018 - 2022 and Forecast 2023 - 2029 by Sales Value USD Million, Y-o-Y Growth (%), and Market Share (%) |
| 10.3.1.North America |
| 10.3.2.Europe |
| 10.3.3.Asia Pacific |
| 10.3.4.Latin America |
| 10.3.5.MEA |
| 10.4. Country Analysis 2018 - 2022 and Forecast 2023 - 2029 by Sales Value USD Million, Y-o-Y Growth (%), and Market Share (%) |
| 10.4.1.Germany |
| 10.4.2.France |
| 10.4.3.Italy |
| 10.4.4.United Kingdom (UK) |
| 10.4.5.Spain |
| 10.4.6.Rest of EU |
| 11. Asia Pacific (APAC) Non-steroidal Anti-inflammatory Drugs (NSAIDs) Market ,2018 - 2022 and Forecast 2023 - 2029 (Sales Value USD Million) |
| 11.1. Molecule Type Analysis and Forecast by Sales Value USD Million, Y-o-Y Growth (%), and Market Share (%) |
| 11.1.1.Ibuprofen |
| 11.1.2.Aspirin |
| 11.1.3.Paracetamol |
| 11.1.4.Diclofenac |
| 11.1.5.Others |
| 11.2. Formulation Analysis 2018 - 2022 and Forecast 2023 - 2029 by Sales Value USD Million, Y-o-Y Growth (%), and Market Share (%) |
| 11.2.1.Tablets |
| 11.2.2.Capsules |
| 11.2.3.Suspension |
| 11.2.4.Topical Preparations |
| 11.2.5.Others |
| 11.3. Geography Analysis 2018 - 2022 and Forecast 2023 - 2029 by Sales Value USD Million, Y-o-Y Growth (%), and Market Share (%) |
| 11.3.1.North America |
| 11.3.2.Europe |
| 11.3.3.Asia Pacific |
| 11.3.4.Latin America |
| 11.3.5.MEA |
| 11.4. Country Analysis 2018 - 2022 and Forecast 2023 - 2029 by Sales Value USD Million, Y-o-Y Growth (%), and Market Share (%) |
| 11.4.1.China |
| 11.4.2.India |
| 11.4.3.Australia and New Zealand (ANZ) |
| 11.4.4.Japan |
| 11.4.5.Rest of APAC |
| 12. Middle East and Africa (MEA) Non-steroidal Anti-inflammatory Drugs (NSAIDs) Market ,2018 - 2022 and Forecast 2023 - 2029 (Sales Value USD Million) |
| 12.1. Molecule Type Analysis and Forecast by Sales Value USD Million, Y-o-Y Growth (%), and Market Share (%) |
| 12.1.1.Ibuprofen |
| 12.1.2.Aspirin |
| 12.1.3.Paracetamol |
| 12.1.4.Diclofenac |
| 12.1.5.Others |
| 12.2. Formulation Analysis 2018 - 2022 and Forecast 2023 - 2029 by Sales Value USD Million, Y-o-Y Growth (%), and Market Share (%) |
| 12.2.1.Tablets |
| 12.2.2.Capsules |
| 12.2.3.Suspension |
| 12.2.4.Topical Preparations |
| 12.2.5.Others |
| 12.3. Geography Analysis 2018 - 2022 and Forecast 2023 - 2029 by Sales Value USD Million, Y-o-Y Growth (%), and Market Share (%) |
| 12.3.1.North America |
| 12.3.2.Europe |
| 12.3.3.Asia Pacific |
| 12.3.4.Latin America |
| 12.3.5.MEA |
| 12.4. Country Analysis 2018 - 2022 and Forecast 2023 - 2029 by Sales Value USD Million, Y-o-Y Growth (%), and Market Share (%) |
| 12.4.1.GCC Countries |
| 12.4.2.South Africa |
| 12.4.3.Rest of MEA |
| 13. Latin America Non-steroidal Anti-inflammatory Drugs (NSAIDs) Market ,2018 - 2022 and Forecast 2023 - 2029 (Sales Value USD Million) |
| 13.1. Molecule Type Analysis and Forecast by Sales Value USD Million, Y-o-Y Growth (%), and Market Share (%) |
| 13.1.1.Ibuprofen |
| 13.1.2.Aspirin |
| 13.1.3.Paracetamol |
| 13.1.4.Diclofenac |
| 13.1.5.Others |
| 13.2. Formulation Analysis 2018 - 2022 and Forecast 2023 - 2029 by Sales Value USD Million, Y-o-Y Growth (%), and Market Share (%) |
| 13.2.1.Tablets |
| 13.2.2.Capsules |
| 13.2.3.Suspension |
| 13.2.4.Topical Preparations |
| 13.2.5.Others |
| 13.3. Geography Analysis 2018 - 2022 and Forecast 2023 - 2029 by Sales Value USD Million, Y-o-Y Growth (%), and Market Share (%) |
| 13.3.1.North America |
| 13.3.2.Europe |
| 13.3.3.Asia Pacific |
| 13.3.4.Latin America |
| 13.3.5.MEA |
| 13.4. Country Analysis 2018 - 2022 and Forecast 2023 - 2029 by Sales Value USD Million, Y-o-Y Growth (%), and Market Share (%) |
| 13.4.1.Brazil |
| 13.4.2.Mexico |
| 13.4.3.Rest of LA |
| 14. Competition Landscape |
| 14.1. Market Player Profiles (Introduction, Brand/Product Sales, Financial Analysis, Product Offerings, Key Developments, Collaborations, M & A, Strategies, and SWOT Analysis) |
| 14.2.1.Pfizer Inc. |
| 14.2.2.GlaxoSmithKline plc |
| 14.2.3.Boehringer Ingelheim International GmbH |
| 14.2.4.Johnson & Johnson Services, Inc. |
| 14.2.5.Bayer AG |
| 14.2.6.AstraZeneca |
| 14.2.7.Zyla Life Sciences |
| 14.2.8.Horizon Therapeutics plc |
| 15. Research Methodology |
| 16. Appendix and Abbreviations |
- Pfizer Inc.
- GlaxoSmithKline plc
- Boehringer Ingelheim International GmbH
- Johnson & Johnson Services, Inc.
- Bayer AG
- AstraZeneca
- Zyla Life Sciences
- Horizon Therapeutics plc
