
 Download Sample


Author
Sravani is a proficient Business Analyst with an MBA and a background in Computer Science, with seven years of expe.....
Plant-Based Nutrition Market: By Type, By Product Type, By End User and Region Forecast 2021-2032
Report ID:731380
Published Date:Nov 2025
No of Pages:200
Format:

Plant-Based Nutrition Market size was valued at US$ 14,652.6 million in 2025 and is expected to reach US$ 28,192.3 million by 2032, growing at a significant CAGR of 9.8% from 2026-2032. According to WHO, Nutrition is a critical part of health and development. Better nutrition is related to improved infant, child and maternal health, stronger immune systems, safer pregnancy and childbirth, lower risk of non-communicable diseases (such as diabetes and cardiovascular disease), and longevity. Healthy children learn better. The rapid shifting of public towards health and nutrition, rise in the demand for nutrition products in the market which drive the market across the world, obesity and changing lifestyles lower the nutrition factor of the people, people are shifting towards plant-based nutrition to avoid animal source fat.
An increase in new technology and innovations in the food habits of the people creates new opportunities for the market. The rise in health awareness but expensive eye supplements for plant-based nutrition are the restraints for the market Anyhow the cost decrease will lead to an increase in the market for plant-based nutrition.

Study Period
2026-2032Base Year
2025CAGR
9.8%Largest Market
Asia-PacificFastest Growing Market
North-America
The increasing health awareness and healthy lifestyle across the world is the major market driver in the Plant-based Nutrition Market during the forecast period. Change in the lifestyle of people is the major factor which lowers the nutrition factor of the human body, the nutrition needed to the body due lifestyle constraints to get, nutraceuticals are innovating towards plant-based nutrition which drive the market. Hence, this will drive the global market growth at a significant rate.
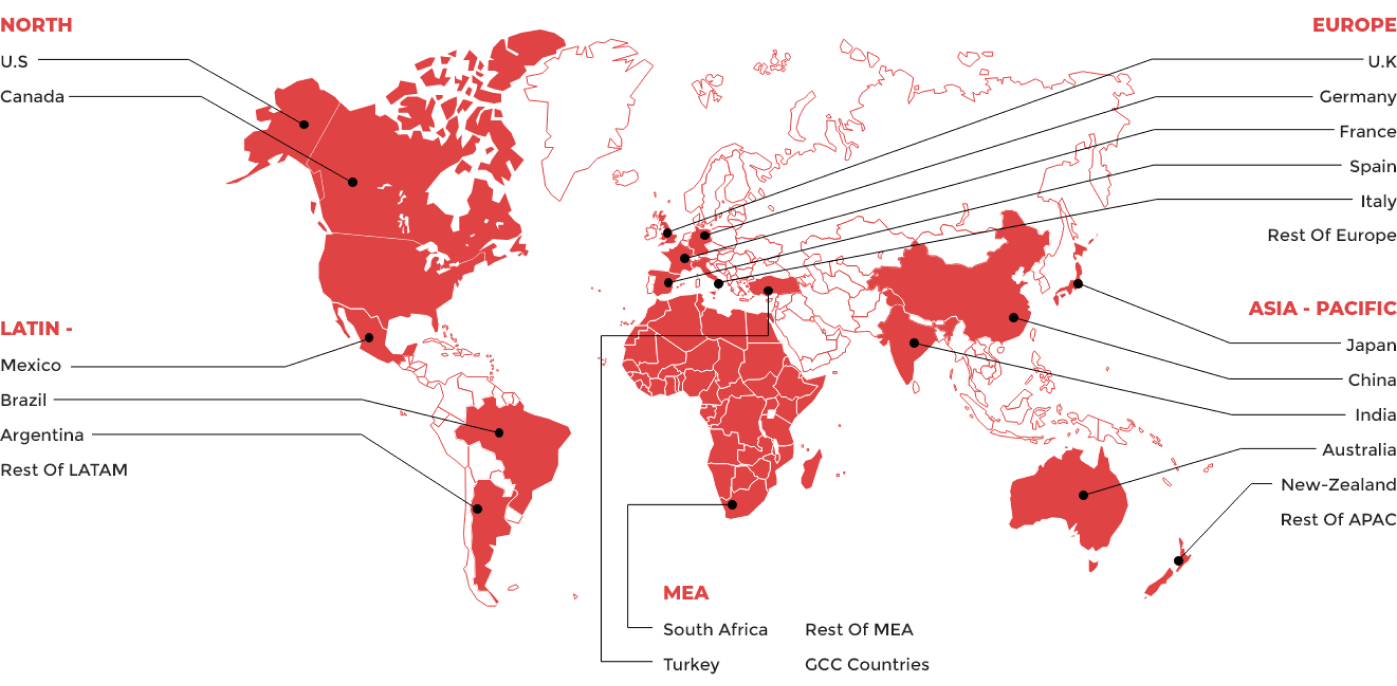
Based on regions, the market share was segmented into North America, Asia-pacific, Europe, and the Middle East, and the African region. The Plant-based Nutrition Market in the Asia Pacific is likely to hold a significant revenue share in 2022, and, in the following years, it is predicted to increase rapidly. It is attributed to the increasing number of plant-based supplement and rapidly growing well-developed infrastructure. Due to a greater number of vegetarian people in the region and others are shifting towards plant-based nutrition which increase the demand in the region. Europe is holding the major market share in the global market and is expected to dominate the market in the upcoming years due to global key players in this region.

Latin America

Europe

Asia Pacific

Middle East

North America
|
Report Benchmarks |
Details |
|
Report Study Period |
2026-2032 |
|
Market CAGR |
9.8% |
|
By Type |
|
|
By Product Type |
|
|
By End User |
|
|
By Region |
|
Download Free Sample Report
![]()
The plant-based nutrition market size was valued at US$ 14,652.6 million in 2025 and is expected to reach US$ 28,192.3 million by 2032, growing at a significant CAGR of 9.8% from 2026-2032
The market key players are: Med Vox Nutrition Elmed Life Sciences Pvt Ltd. Divi's Nutraceutical Lifecare Neuro Matsun Nutrition Kerry Glanbia BioVit Laboratories
The market has been classified into North America, Asia Pacific, Europe, Latin America, Middle East and Africa, and the rest of MEA.
Content Updated Date: Mar 2026
| 1. Executive Summary |
| 2. Global Plant-Based Nutrition Market Introduction |
| 2.1.Global Plant-Based Nutrition Market - Taxonomy |
| 2.2.Global Plant-Based Nutrition Market - Definitions |
| 2.2.1.Type |
| 2.2.2.Product Type |
| 2.2.3.End Users |
| 2.2.4.Geography |
| 2.2.5.Region |
| 3. Global Plant-Based Nutrition Market Dynamics |
| 3.1. Drivers |
| 3.2. Restraints |
| 3.3. Opportunities/Unmet Needs of the Market |
| 3.4. Trends |
| 3.5. Product Landscape |
| 3.6. New Product Launches |
| 3.7. Impact of COVID 19 on Market |
| 4. Global Plant-Based Nutrition Market Analysis, 2021 - 2025 and Forecast 2026 - 2032 |
| 4.1. Market Analysis, 2021 - 2025 and Forecast 2026 - 2032, (Sales Value USD Million) |
| 4.2. Year-Over-Year (Y-o-Y) Growth Analysis (%) |
| 4.3. Market Opportunity Analysis |
| 5. Global Plant-Based Nutrition Market By Type, 2021 - 2025 and Forecast 2026 - 2032 (Sales Value USD Million) |
| 5.1. Protein |
| 5.1.1. Market Analysis, 2021 - 2025 and Forecast 2026 - 2032, (Sales Value USD Million) |
| 5.1.2. Year-Over-Year (Y-o-Y) Growth Analysis (%) and Market Share Analysis (%) |
| 5.1.3. Market Opportunity Analysis |
| 5.2. Carbohydrate |
| 5.2.1. Market Analysis, 2021 - 2025 and Forecast 2026 - 2032, (Sales Value USD Million) |
| 5.2.2. Year-Over-Year (Y-o-Y) Growth Analysis (%) and Market Share Analysis (%) |
| 5.2.3. Market Opportunity Analysis |
| 5.3. Fats |
| 5.3.1. Market Analysis, 2021 - 2025 and Forecast 2026 - 2032, (Sales Value USD Million) |
| 5.3.2. Year-Over-Year (Y-o-Y) Growth Analysis (%) and Market Share Analysis (%) |
| 5.3.3. Market Opportunity Analysis |
| 5.4. Vitamin |
| 5.4.1. Market Analysis, 2021 - 2025 and Forecast 2026 - 2032, (Sales Value USD Million) |
| 5.4.2. Year-Over-Year (Y-o-Y) Growth Analysis (%) and Market Share Analysis (%) |
| 5.4.3. Market Opportunity Analysis |
| 5.5. Minerals |
| 5.5.1. Market Analysis, 2021 - 2025 and Forecast 2026 - 2032, (Sales Value USD Million) |
| 5.5.2. Year-Over-Year (Y-o-Y) Growth Analysis (%) and Market Share Analysis (%) |
| 5.5.3. Market Opportunity Analysis |
| 6. Global Plant-Based Nutrition Market By Product Type , 2021 - 2025 and Forecast 2026 - 2032 (Sales Value USD Million) |
| 6.1. Iron Products |
| 6.1.1. Market Analysis, 2021 - 2025 and Forecast 2026 - 2032, (Sales Value USD Million) |
| 6.1.2. Year-Over-Year (Y-o-Y) Growth Analysis (%) and Market Share Analysis (%) |
| 6.1.3. Market Opportunity Analysis |
| 6.2. Minerals and Electrolytes |
| 6.2.1. Market Analysis, 2021 - 2025 and Forecast 2026 - 2032, (Sales Value USD Million) |
| 6.2.2. Year-Over-Year (Y-o-Y) Growth Analysis (%) and Market Share Analysis (%) |
| 6.2.3. Market Opportunity Analysis |
| 6.3. Oral Nutritional Supplements |
| 6.3.1. Market Analysis, 2021 - 2025 and Forecast 2026 - 2032, (Sales Value USD Million) |
| 6.3.2. Year-Over-Year (Y-o-Y) Growth Analysis (%) and Market Share Analysis (%) |
| 6.3.3. Market Opportunity Analysis |
| 6.4. Vitamin and Mineral Combinations |
| 6.4.1. Market Analysis, 2021 - 2025 and Forecast 2026 - 2032, (Sales Value USD Million) |
| 6.4.2. Year-Over-Year (Y-o-Y) Growth Analysis (%) and Market Share Analysis (%) |
| 6.4.3. Market Opportunity Analysis |
| 7. Global Plant-Based Nutrition Market By End Users, 2021 - 2025 and Forecast 2026 - 2032 (Sales Value USD Million) |
| 7.1. Nutraceutical |
| 7.1.1. Market Analysis, 2021 - 2025 and Forecast 2026 - 2032, (Sales Value USD Million) |
| 7.1.2. Year-Over-Year (Y-o-Y) Growth Analysis (%) and Market Share Analysis (%) |
| 7.1.3. Market Opportunity Analysis |
| 7.2. Dietary |
| 7.2.1. Market Analysis, 2021 - 2025 and Forecast 2026 - 2032, (Sales Value USD Million) |
| 7.2.2. Year-Over-Year (Y-o-Y) Growth Analysis (%) and Market Share Analysis (%) |
| 7.2.3. Market Opportunity Analysis |
| 7.3. Others |
| 7.3.1. Market Analysis, 2021 - 2025 and Forecast 2026 - 2032, (Sales Value USD Million) |
| 7.3.2. Year-Over-Year (Y-o-Y) Growth Analysis (%) and Market Share Analysis (%) |
| 7.3.3. Market Opportunity Analysis |
| 8. Global Plant-Based Nutrition Market By Geography, 2021 - 2025 and Forecast 2026 - 2032 (Sales Value USD Million) |
| 8.1. North America |
| 8.1.1. Market Analysis, 2021 - 2025 and Forecast 2026 - 2032, (Sales Value USD Million) |
| 8.1.2. Year-Over-Year (Y-o-Y) Growth Analysis (%) and Market Share Analysis (%) |
| 8.1.3. Market Opportunity Analysis |
| 8.2. Europe |
| 8.2.1. Market Analysis, 2021 - 2025 and Forecast 2026 - 2032, (Sales Value USD Million) |
| 8.2.2. Year-Over-Year (Y-o-Y) Growth Analysis (%) and Market Share Analysis (%) |
| 8.2.3. Market Opportunity Analysis |
| 8.3. The Asia Pacific |
| 8.3.1. Market Analysis, 2021 - 2025 and Forecast 2026 - 2032, (Sales Value USD Million) |
| 8.3.2. Year-Over-Year (Y-o-Y) Growth Analysis (%) and Market Share Analysis (%) |
| 8.3.3. Market Opportunity Analysis |
| 8.4. Latin America |
| 8.4.1. Market Analysis, 2021 - 2025 and Forecast 2026 - 2032, (Sales Value USD Million) |
| 8.4.2. Year-Over-Year (Y-o-Y) Growth Analysis (%) and Market Share Analysis (%) |
| 8.4.3. Market Opportunity Analysis |
| 8.5. MEA |
| 8.5.1. Market Analysis, 2021 - 2025 and Forecast 2026 - 2032, (Sales Value USD Million) |
| 8.5.2. Year-Over-Year (Y-o-Y) Growth Analysis (%) and Market Share Analysis (%) |
| 8.5.3. Market Opportunity Analysis |
| 9. Global Plant-Based Nutrition Market By Region, 2021 - 2025 and Forecast 2026 - 2032 (Sales Value USD Million) |
| 9.1. North America |
| 9.1.1. Market Analysis, 2021 - 2025 and Forecast 2026 - 2032, (Sales Value USD Million) |
| 9.1.2. Year-Over-Year (Y-o-Y) Growth Analysis (%) and Market Share Analysis (%) |
| 9.1.3. Market Opportunity Analysis |
| 9.2. Europe |
| 9.2.1. Market Analysis, 2021 - 2025 and Forecast 2026 - 2032, (Sales Value USD Million) |
| 9.2.2. Year-Over-Year (Y-o-Y) Growth Analysis (%) and Market Share Analysis (%) |
| 9.2.3. Market Opportunity Analysis |
| 9.3. Asia Pacific (APAC) |
| 9.3.1. Market Analysis, 2021 - 2025 and Forecast 2026 - 2032, (Sales Value USD Million) |
| 9.3.2. Year-Over-Year (Y-o-Y) Growth Analysis (%) and Market Share Analysis (%) |
| 9.3.3. Market Opportunity Analysis |
| 9.4. Middle East and Africa (MEA) |
| 9.4.1. Market Analysis, 2021 - 2025 and Forecast 2026 - 2032, (Sales Value USD Million) |
| 9.4.2. Year-Over-Year (Y-o-Y) Growth Analysis (%) and Market Share Analysis (%) |
| 9.4.3. Market Opportunity Analysis |
| 9.5. Latin America |
| 9.5.1. Market Analysis, 2021 - 2025 and Forecast 2026 - 2032, (Sales Value USD Million) |
| 9.5.2. Year-Over-Year (Y-o-Y) Growth Analysis (%) and Market Share Analysis (%) |
| 9.5.3. Market Opportunity Analysis |
| 10. North America Plant-Based Nutrition Market ,2021 - 2025 and Forecast 2026 - 2032 (Sales Value USD Million) |
| 10.1. Type Analysis 2021 - 2025 and Forecast 2026 - 2032 by Sales Value USD Million, Y-o-Y Growth (%), and Market Share (%) |
| 10.1.1.Protein |
| 10.1.2.Carbohydrate |
| 10.1.3.Fats |
| 10.1.4.Vitamin |
| 10.1.5.Minerals |
| 10.2. Product Type Analysis 2021 - 2025 and Forecast 2026 - 2032 by Sales Value USD Million, Y-o-Y Growth (%), and Market Share (%) |
| 10.2.1.Iron Products |
| 10.2.2.Minerals and Electrolytes |
| 10.2.3.Oral Nutritional Supplements |
| 10.2.4.Vitamin and Mineral Combinations |
| 10.3. End Users Analysis 2021 - 2025 and Forecast 2026 - 2032 by Sales Value USD Million, Y-o-Y Growth (%), and Market Share (%) |
| 10.3.1.Nutraceutical |
| 10.3.2.Dietary |
| 10.3.3.Others |
| 10.4. Geography Analysis 2021 - 2025 and Forecast 2026 - 2032 by Sales Value USD Million, Y-o-Y Growth (%), and Market Share (%) |
| 10.4.1.North America |
| 10.4.2.Europe |
| 10.4.3.The Asia Pacific |
| 10.4.4.Latin America |
| 10.4.5.MEA |
| 10.5. Country Analysis 2021 - 2025 and Forecast 2026 - 2032 by Sales Value USD Million, Y-o-Y Growth (%), and Market Share (%) |
| 10.5.1.United States of America (USA) |
| 10.5.2.Canada |
| 11. Europe Plant-Based Nutrition Market ,2021 - 2025 and Forecast 2026 - 2032 (Sales Value USD Million) |
| 11.1. Type Analysis and Forecast by Sales Value USD Million, Y-o-Y Growth (%), and Market Share (%) |
| 11.1.1.Protein |
| 11.1.2.Carbohydrate |
| 11.1.3.Fats |
| 11.1.4.Vitamin |
| 11.1.5.Minerals |
| 11.2. Product Type Analysis 2021 - 2025 and Forecast 2026 - 2032 by Sales Value USD Million, Y-o-Y Growth (%), and Market Share (%) |
| 11.2.1.Iron Products |
| 11.2.2.Minerals and Electrolytes |
| 11.2.3.Oral Nutritional Supplements |
| 11.2.4.Vitamin and Mineral Combinations |
| 11.3. End Users Analysis 2021 - 2025 and Forecast 2026 - 2032 by Sales Value USD Million, Y-o-Y Growth (%), and Market Share (%) |
| 11.3.1.Nutraceutical |
| 11.3.2.Dietary |
| 11.3.3.Others |
| 11.4. Geography Analysis 2021 - 2025 and Forecast 2026 - 2032 by Sales Value USD Million, Y-o-Y Growth (%), and Market Share (%) |
| 11.4.1.North America |
| 11.4.2.Europe |
| 11.4.3.The Asia Pacific |
| 11.4.4.Latin America |
| 11.4.5.MEA |
| 11.5. Country Analysis 2021 - 2025 and Forecast 2026 - 2032 by Sales Value USD Million, Y-o-Y Growth (%), and Market Share (%) |
| 11.5.1.Germany |
| 11.5.2.France |
| 11.5.3.Italy |
| 11.5.4.United Kingdom (UK) |
| 11.5.5.Spain |
| 11.5.6.Rest of EU |
| 12. Asia Pacific (APAC) Plant-Based Nutrition Market ,2021 - 2025 and Forecast 2026 - 2032 (Sales Value USD Million) |
| 12.1. Type Analysis and Forecast by Sales Value USD Million, Y-o-Y Growth (%), and Market Share (%) |
| 12.1.1.Protein |
| 12.1.2.Carbohydrate |
| 12.1.3.Fats |
| 12.1.4.Vitamin |
| 12.1.5.Minerals |
| 12.2. Product Type Analysis 2021 - 2025 and Forecast 2026 - 2032 by Sales Value USD Million, Y-o-Y Growth (%), and Market Share (%) |
| 12.2.1.Iron Products |
| 12.2.2.Minerals and Electrolytes |
| 12.2.3.Oral Nutritional Supplements |
| 12.2.4.Vitamin and Mineral Combinations |
| 12.3. End Users Analysis 2021 - 2025 and Forecast 2026 - 2032 by Sales Value USD Million, Y-o-Y Growth (%), and Market Share (%) |
| 12.3.1.Nutraceutical |
| 12.3.2.Dietary |
| 12.3.3.Others |
| 12.4. Geography Analysis 2021 - 2025 and Forecast 2026 - 2032 by Sales Value USD Million, Y-o-Y Growth (%), and Market Share (%) |
| 12.4.1.North America |
| 12.4.2.Europe |
| 12.4.3.The Asia Pacific |
| 12.4.4.Latin America |
| 12.4.5.MEA |
| 12.5. Country Analysis 2021 - 2025 and Forecast 2026 - 2032 by Sales Value USD Million, Y-o-Y Growth (%), and Market Share (%) |
| 12.5.1.China |
| 12.5.2.India |
| 12.5.3.Australia and New Zealand (ANZ) |
| 12.5.4.Japan |
| 12.5.5.Rest of APAC |
| 13. Middle East and Africa (MEA) Plant-Based Nutrition Market ,2021 - 2025 and Forecast 2026 - 2032 (Sales Value USD Million) |
| 13.1. Type Analysis and Forecast by Sales Value USD Million, Y-o-Y Growth (%), and Market Share (%) |
| 13.1.1.Protein |
| 13.1.2.Carbohydrate |
| 13.1.3.Fats |
| 13.1.4.Vitamin |
| 13.1.5.Minerals |
| 13.2. Product Type Analysis 2021 - 2025 and Forecast 2026 - 2032 by Sales Value USD Million, Y-o-Y Growth (%), and Market Share (%) |
| 13.2.1.Iron Products |
| 13.2.2.Minerals and Electrolytes |
| 13.2.3.Oral Nutritional Supplements |
| 13.2.4.Vitamin and Mineral Combinations |
| 13.3. End Users Analysis 2021 - 2025 and Forecast 2026 - 2032 by Sales Value USD Million, Y-o-Y Growth (%), and Market Share (%) |
| 13.3.1.Nutraceutical |
| 13.3.2.Dietary |
| 13.3.3.Others |
| 13.4. Geography Analysis 2021 - 2025 and Forecast 2026 - 2032 by Sales Value USD Million, Y-o-Y Growth (%), and Market Share (%) |
| 13.4.1.North America |
| 13.4.2.Europe |
| 13.4.3.The Asia Pacific |
| 13.4.4.Latin America |
| 13.4.5.MEA |
| 13.5. Country Analysis 2021 - 2025 and Forecast 2026 - 2032 by Sales Value USD Million, Y-o-Y Growth (%), and Market Share (%) |
| 13.5.1.GCC Countries |
| 13.5.2.South Africa |
| 13.5.3.Rest of MEA |
| 14. Latin America Plant-Based Nutrition Market ,2021 - 2025 and Forecast 2026 - 2032 (Sales Value USD Million) |
| 14.1. Type Analysis and Forecast by Sales Value USD Million, Y-o-Y Growth (%), and Market Share (%) |
| 14.1.1.Protein |
| 14.1.2.Carbohydrate |
| 14.1.3.Fats |
| 14.1.4.Vitamin |
| 14.1.5.Minerals |
| 14.2. Product Type Analysis 2021 - 2025 and Forecast 2026 - 2032 by Sales Value USD Million, Y-o-Y Growth (%), and Market Share (%) |
| 14.2.1.Iron Products |
| 14.2.2.Minerals and Electrolytes |
| 14.2.3.Oral Nutritional Supplements |
| 14.2.4.Vitamin and Mineral Combinations |
| 14.3. End Users Analysis 2021 - 2025 and Forecast 2026 - 2032 by Sales Value USD Million, Y-o-Y Growth (%), and Market Share (%) |
| 14.3.1.Nutraceutical |
| 14.3.2.Dietary |
| 14.3.3.Others |
| 14.4. Geography Analysis 2021 - 2025 and Forecast 2026 - 2032 by Sales Value USD Million, Y-o-Y Growth (%), and Market Share (%) |
| 14.4.1.North America |
| 14.4.2.Europe |
| 14.4.3.The Asia Pacific |
| 14.4.4.Latin America |
| 14.4.5.MEA |
| 14.5. Country Analysis 2021 - 2025 and Forecast 2026 - 2032 by Sales Value USD Million, Y-o-Y Growth (%), and Market Share (%) |
| 14.5.1.Brazil |
| 14.5.2.Mexico |
| 14.5.3.Rest of LA |
| 15. Competition Landscape |
| 15.1. Market Player Profiles (Introduction, Brand/Product Sales, Financial Analysis, Product Offerings, Key Developments, Collaborations, M & A, Strategies, and SWOT Analysis) |
| 15.2.1.Med Vox Nutrition |
| 15.2.2.Elmed Life Sciences Pvt Ltd. |
| 15.2.3.Divi's Nutraceutical |
| 15.2.4.Lifecare Neuro |
| 15.2.5.Matsun Nutrition |
| 15.2.6.Kerry |
| 15.2.7.Glanbia |
| 15.2.8.BioVit Laboratories |
| 16. Research Methodology |
| 17. Appendix and Abbreviations |
Key Market Players
Author
Sravani is a proficient Business Analyst with an MBA and a background in Computer Science, with seven years of experience in the field of market research. Sravani is adept at creating competitive evaluations, precise market estimations, and market projections, emphasizing the food and beverage and information and communication technology (ICT) industries. Her areas of competence are identifying important players, projecting market trends, and assessing the potential for industry growth. She applies a strong analytical approach to provide precise market estimates and thorough industry analysis, empowering organizations to make data-driven decisions. Sravani's estimating and forecasting abilities are essential for businesses to take advantage of new opportunities and effectively manage dynamic market environments.