
 Download Sample


Author
Muni Kumar Meravath is a seasoned Healthcare Market Research Analyst with over 6 years of experience in the healthc.....
Real World Evidence Solutions Market Size, Share, Growth, Trends, and Industry Analysis: By Component, By Indication and Region Forecast 2021-2032
Report ID:915594
Published Date:Nov 2025
No of Pages:205
Format:

Real World Evidence Solutions Market size was valued at US$ 3.5 billion in 2025 and is expected to reach US$ 6.3 billion by 2032, growing at a significant CAGR of 8.8% from 2026-2032. Real-world evidence is clinically gathered data through various studies and analyses which helps pharmaceuticals, medical device companies, and healthcare providers to implement new products or services in the market. Real-world data include randomized trials, simple trials, and observational studies. The growing amount of big data in healthcare, the shift from volume to value-based care, and the rising focus on personalized healthcare are expected to positively impact the RWE solutions market.
Pharmaceutical healthcare providers are ready to invest in the development of novel drugs and services, to the demand for drug discovery and development they are shifting to outsourcing data and services, to get data for early and late-stage phases. With the prevalence of increase in research & development expenditure, pharmaceuticals need preclinical and post-clinical services which drive the market for real-world evidence solutions. Although, key players started using real-world evidence solutions for randomized solutions clinical data results increase the opportunity real word evidence solutions. The lack of consensus and real-world evidence standard lacks in quality to be part of the body of evidence to determine the comparative effectiveness of different treatment options.
Study Period
2026-2032Base Year
2025CAGR
8.8%Largest Market
Asia-PacificFastest Growing Market
North-America
The increasing prevalence of clinical data outsourcing across the world is the major market driver in the Real-World Evidence Solutions Market during the forecast period. Outsourcing of data to gain new segment of the market through clinical trials provide information for the new research and development sector which drives the market, gaining information on a clinical trial, and other drug data to use for new research and development. Hence, this will drive global market growth at a significant rate.
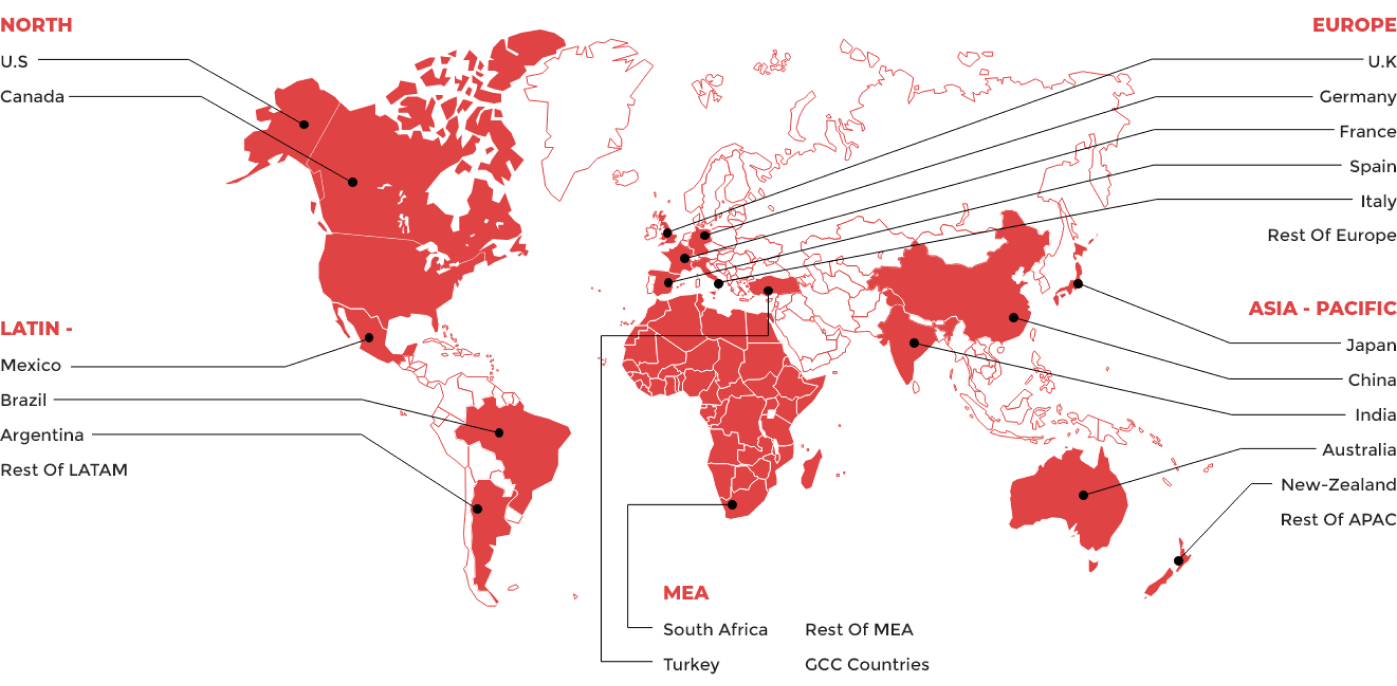
Based on regions, the market share is segmented into North America, Asia-pacific, Europe, the Middle East, and the African region. The real-world evidence solutions market in the Asia Pacific is likely to hold a significant revenue share in 2021, and, in the following years, it is predicted to increase rapidly. It is attributed to the increasing number of various diseases and rapidly growing well-developed healthcare infrastructure, providing a new market for the pharmaceuticals to opt for new drug development in the region. North America is holding the major market share in the global market due to high security and clinical trials in the region, an increase in the demand for the healthcare service provider in the region to standardize the clinical data and provide it to the R&D to develop new drugs for the nation, which results from it is expected to dominate the market in the upcoming years due to global key players in this region.

Latin America

Europe

Asia Pacific

Middle East

North America
|
Report Benchmarks |
Details |
|
Report Study Period |
2026-2032 |
|
Market CAGR |
8.8% |
|
By Component |
|
|
By Indication |
|
|
By Region |
|
Download Free Sample Report
![]()
The real world evidence solutions market size was valued at US$ 3.5 billion in 2025 and is expected to reach US$ 6.3 billion by 2032, growing at a significant CAGR of 8.8% from 2026-2032
The leading players in the Real-World Evidence Solutions Market are IQVIA, IBM, PPD Inc., Parexel International Corporation, PerkinElmer Inc., Icon Plc, Oracle, Syneos Health, Cegedim Health Data, Medpace,
Historic years considered for the market study are 2018 through 2022, 2022 is considered as the base year for market estimation and Seven years forecast is presented from 2023 – 2029.
Content Updated Date: Mar 2026
| 1.Executive Summary |
| 2.Global Real World Evidence Solutions Market Introduction |
| 2.1.Global Real World Evidence Solutions Market - Taxonomy |
| 2.2.Global Real World Evidence Solutions Market - Definitions |
| 2.2.1.Component |
| 2.2.2.Indication |
| 2.2.3.Geography |
| 2.2.4.Region |
| 3.Global Real World Evidence Solutions Market Dynamics |
| 3.1. Drivers |
| 3.2. Restraints |
| 3.3. Opportunities/Unmet Needs of the Market |
| 3.4. Trends |
| 3.5. Product Landscape |
| 3.6. New Product Launches |
| 3.7. Impact of COVID 19 on Market |
| 4.Global Real World Evidence Solutions Market Analysis, 2021 - 2025 and Forecast 2026 - 2032 |
| 4.1. Market Analysis, 2021 - 2025 and Forecast 2026 - 2032, (Sales Value USD Million) |
| 4.2. Year-Over-Year (Y-o-Y) Growth Analysis (%) |
| 4.3. Market Opportunity Analysis |
| 5.Global Real World Evidence Solutions Market By Component, 2021 - 2025 and Forecast 2026 - 2032 (Sales Value USD Million) |
| 5.1. Claims Data |
| 5.1.1. Market Analysis, 2021 - 2025 and Forecast 2026 - 2032, (Sales Value USD Million) |
| 5.1.2. Year-Over-Year (Y-o-Y) Growth Analysis (%) and Market Share Analysis (%) |
| 5.1.3. Market Opportunity Analysis |
| 5.2. Clinical Data Setting |
| 5.2.1. Market Analysis, 2021 - 2025 and Forecast 2026 - 2032, (Sales Value USD Million) |
| 5.2.2. Year-Over-Year (Y-o-Y) Growth Analysis (%) and Market Share Analysis (%) |
| 5.2.3. Market Opportunity Analysis |
| 5.3. Pharmacy data |
| 5.3.1. Market Analysis, 2021 - 2025 and Forecast 2026 - 2032, (Sales Value USD Million) |
| 5.3.2. Year-Over-Year (Y-o-Y) Growth Analysis (%) and Market Share Analysis (%) |
| 5.3.3. Market Opportunity Analysis |
| 5.4. Others |
| 5.4.1. Market Analysis, 2021 - 2025 and Forecast 2026 - 2032, (Sales Value USD Million) |
| 5.4.2. Year-Over-Year (Y-o-Y) Growth Analysis (%) and Market Share Analysis (%) |
| 5.4.3. Market Opportunity Analysis |
| 6.Global Real World Evidence Solutions Market By Indication, 2021 - 2025 and Forecast 2026 - 2032 (Sales Value USD Million) |
| 6.1. Cardiovascular diseases |
| 6.1.1. Market Analysis, 2021 - 2025 and Forecast 2026 - 2032, (Sales Value USD Million) |
| 6.1.2. Year-Over-Year (Y-o-Y) Growth Analysis (%) and Market Share Analysis (%) |
| 6.1.3. Market Opportunity Analysis |
| 6.2. Oncology |
| 6.2.1. Market Analysis, 2021 - 2025 and Forecast 2026 - 2032, (Sales Value USD Million) |
| 6.2.2. Year-Over-Year (Y-o-Y) Growth Analysis (%) and Market Share Analysis (%) |
| 6.2.3. Market Opportunity Analysis |
| 6.3. Neurology |
| 6.3.1. Market Analysis, 2021 - 2025 and Forecast 2026 - 2032, (Sales Value USD Million) |
| 6.3.2. Year-Over-Year (Y-o-Y) Growth Analysis (%) and Market Share Analysis (%) |
| 6.3.3. Market Opportunity Analysis |
| 6.4. Urology |
| 6.4.1. Market Analysis, 2021 - 2025 and Forecast 2026 - 2032, (Sales Value USD Million) |
| 6.4.2. Year-Over-Year (Y-o-Y) Growth Analysis (%) and Market Share Analysis (%) |
| 6.4.3. Market Opportunity Analysis |
| 6.5. Others |
| 6.5.1. Market Analysis, 2021 - 2025 and Forecast 2026 - 2032, (Sales Value USD Million) |
| 6.5.2. Year-Over-Year (Y-o-Y) Growth Analysis (%) and Market Share Analysis (%) |
| 6.5.3. Market Opportunity Analysis |
| 7.Global Real World Evidence Solutions Market By Geography, 2021 - 2025 and Forecast 2026 - 2032 (Sales Value USD Million) |
| 7.1. North America |
| 7.1.1. Market Analysis, 2021 - 2025 and Forecast 2026 - 2032, (Sales Value USD Million) |
| 7.1.2. Year-Over-Year (Y-o-Y) Growth Analysis (%) and Market Share Analysis (%) |
| 7.1.3. Market Opportunity Analysis |
| 7.2. Europe |
| 7.2.1. Market Analysis, 2021 - 2025 and Forecast 2026 - 2032, (Sales Value USD Million) |
| 7.2.2. Year-Over-Year (Y-o-Y) Growth Analysis (%) and Market Share Analysis (%) |
| 7.2.3. Market Opportunity Analysis |
| 7.3. The Asia Pacific |
| 7.3.1. Market Analysis, 2021 - 2025 and Forecast 2026 - 2032, (Sales Value USD Million) |
| 7.3.2. Year-Over-Year (Y-o-Y) Growth Analysis (%) and Market Share Analysis (%) |
| 7.3.3. Market Opportunity Analysis |
| 7.4. Latin America |
| 7.4.1. Market Analysis, 2021 - 2025 and Forecast 2026 - 2032, (Sales Value USD Million) |
| 7.4.2. Year-Over-Year (Y-o-Y) Growth Analysis (%) and Market Share Analysis (%) |
| 7.4.3. Market Opportunity Analysis |
| 7.5. MEA |
| 7.5.1. Market Analysis, 2021 - 2025 and Forecast 2026 - 2032, (Sales Value USD Million) |
| 7.5.2. Year-Over-Year (Y-o-Y) Growth Analysis (%) and Market Share Analysis (%) |
| 7.5.3. Market Opportunity Analysis |
| 8.Global Real World Evidence Solutions Market By Region, 2021 - 2025 and Forecast 2026 - 2032 (Sales Value USD Million) |
| 8.1. North America |
| 8.1.1. Market Analysis, 2021 - 2025 and Forecast 2026 - 2032, (Sales Value USD Million) |
| 8.1.2. Year-Over-Year (Y-o-Y) Growth Analysis (%) and Market Share Analysis (%) |
| 8.1.3. Market Opportunity Analysis |
| 8.2. Europe |
| 8.2.1. Market Analysis, 2021 - 2025 and Forecast 2026 - 2032, (Sales Value USD Million) |
| 8.2.2. Year-Over-Year (Y-o-Y) Growth Analysis (%) and Market Share Analysis (%) |
| 8.2.3. Market Opportunity Analysis |
| 8.3. Asia Pacific (APAC) |
| 8.3.1. Market Analysis, 2021 - 2025 and Forecast 2026 - 2032, (Sales Value USD Million) |
| 8.3.2. Year-Over-Year (Y-o-Y) Growth Analysis (%) and Market Share Analysis (%) |
| 8.3.3. Market Opportunity Analysis |
| 8.4. Middle East and Africa (MEA) |
| 8.4.1. Market Analysis, 2021 - 2025 and Forecast 2026 - 2032, (Sales Value USD Million) |
| 8.4.2. Year-Over-Year (Y-o-Y) Growth Analysis (%) and Market Share Analysis (%) |
| 8.4.3. Market Opportunity Analysis |
| 8.5. Latin America |
| 8.5.1. Market Analysis, 2021 - 2025 and Forecast 2026 - 2032, (Sales Value USD Million) |
| 8.5.2. Year-Over-Year (Y-o-Y) Growth Analysis (%) and Market Share Analysis (%) |
| 8.5.3. Market Opportunity Analysis |
| 9.North America Real World Evidence Solutions Market ,2021 - 2025 and Forecast 2026 - 2032 (Sales Value USD Million) |
| 9.1. Component Analysis 2021 - 2025 and Forecast 2026 - 2032 by Sales Value USD Million, Y-o-Y Growth (%), and Market Share (%) |
| 9.1.1.Claims Data |
| 9.1.2.Clinical Data Setting |
| 9.1.3.Pharmacy data |
| 9.1.4.Others |
| 9.2. Indication Analysis 2021 - 2025 and Forecast 2026 - 2032 by Sales Value USD Million, Y-o-Y Growth (%), and Market Share (%) |
| 9.2.1.Cardiovascular diseases |
| 9.2.2.Oncology |
| 9.2.3.Neurology |
| 9.2.4.Urology |
| 9.2.5.Others |
| 9.3. Geography Analysis 2021 - 2025 and Forecast 2026 - 2032 by Sales Value USD Million, Y-o-Y Growth (%), and Market Share (%) |
| 9.3.1.North America |
| 9.3.2.Europe |
| 9.3.3.The Asia Pacific |
| 9.3.4.Latin America |
| 9.3.5.MEA |
| 9.4. Country Analysis 2021 - 2025 and Forecast 2026 - 2032 by Sales Value USD Million, Y-o-Y Growth (%), and Market Share (%) |
| 9.4.1.United States of America (USA) |
| 9.4.2.Canada |
| 10.Europe Real World Evidence Solutions Market ,2021 - 2025 and Forecast 2026 - 2032 (Sales Value USD Million) |
| 10.1. Component Analysis and Forecast by Sales Value USD Million, Y-o-Y Growth (%), and Market Share (%) |
| 10.1.1.Claims Data |
| 10.1.2.Clinical Data Setting |
| 10.1.3.Pharmacy data |
| 10.1.4.Others |
| 10.2. Indication Analysis 2021 - 2025 and Forecast 2026 - 2032 by Sales Value USD Million, Y-o-Y Growth (%), and Market Share (%) |
| 10.2.1.Cardiovascular diseases |
| 10.2.2.Oncology |
| 10.2.3.Neurology |
| 10.2.4.Urology |
| 10.2.5.Others |
| 10.3. Geography Analysis 2021 - 2025 and Forecast 2026 - 2032 by Sales Value USD Million, Y-o-Y Growth (%), and Market Share (%) |
| 10.3.1.North America |
| 10.3.2.Europe |
| 10.3.3.The Asia Pacific |
| 10.3.4.Latin America |
| 10.3.5.MEA |
| 10.4. Country Analysis 2021 - 2025 and Forecast 2026 - 2032 by Sales Value USD Million, Y-o-Y Growth (%), and Market Share (%) |
| 10.4.1.Germany |
| 10.4.2.France |
| 10.4.3.Italy |
| 10.4.4.United Kingdom (UK) |
| 10.4.5.Spain |
| 10.4.6.Rest of EU |
| 11.Asia Pacific (APAC) Real World Evidence Solutions Market ,2021 - 2025 and Forecast 2026 - 2032 (Sales Value USD Million) |
| 11.1. Component Analysis and Forecast by Sales Value USD Million, Y-o-Y Growth (%), and Market Share (%) |
| 11.1.1.Claims Data |
| 11.1.2.Clinical Data Setting |
| 11.1.3.Pharmacy data |
| 11.1.4.Others |
| 11.2. Indication Analysis 2021 - 2025 and Forecast 2026 - 2032 by Sales Value USD Million, Y-o-Y Growth (%), and Market Share (%) |
| 11.2.1.Cardiovascular diseases |
| 11.2.2.Oncology |
| 11.2.3.Neurology |
| 11.2.4.Urology |
| 11.2.5.Others |
| 11.3. Geography Analysis 2021 - 2025 and Forecast 2026 - 2032 by Sales Value USD Million, Y-o-Y Growth (%), and Market Share (%) |
| 11.3.1.North America |
| 11.3.2.Europe |
| 11.3.3.The Asia Pacific |
| 11.3.4.Latin America |
| 11.3.5.MEA |
| 11.4. Country Analysis 2021 - 2025 and Forecast 2026 - 2032 by Sales Value USD Million, Y-o-Y Growth (%), and Market Share (%) |
| 11.4.1.China |
| 11.4.2.India |
| 11.4.3.Australia and New Zealand (ANZ) |
| 11.4.4.Japan |
| 11.4.5.Rest of APAC |
| 12.Middle East and Africa (MEA) Real World Evidence Solutions Market ,2021 - 2025 and Forecast 2026 - 2032 (Sales Value USD Million) |
| 12.1. Component Analysis and Forecast by Sales Value USD Million, Y-o-Y Growth (%), and Market Share (%) |
| 12.1.1.Claims Data |
| 12.1.2.Clinical Data Setting |
| 12.1.3.Pharmacy data |
| 12.1.4.Others |
| 12.2. Indication Analysis 2021 - 2025 and Forecast 2026 - 2032 by Sales Value USD Million, Y-o-Y Growth (%), and Market Share (%) |
| 12.2.1.Cardiovascular diseases |
| 12.2.2.Oncology |
| 12.2.3.Neurology |
| 12.2.4.Urology |
| 12.2.5.Others |
| 12.3. Geography Analysis 2021 - 2025 and Forecast 2026 - 2032 by Sales Value USD Million, Y-o-Y Growth (%), and Market Share (%) |
| 12.3.1.North America |
| 12.3.2.Europe |
| 12.3.3.The Asia Pacific |
| 12.3.4.Latin America |
| 12.3.5.MEA |
| 12.4. Country Analysis 2021 - 2025 and Forecast 2026 - 2032 by Sales Value USD Million, Y-o-Y Growth (%), and Market Share (%) |
| 12.4.1.GCC Countries |
| 12.4.2.South Africa |
| 12.4.3.Rest of MEA |
| 13.Latin America Real World Evidence Solutions Market ,2021 - 2025 and Forecast 2026 - 2032 (Sales Value USD Million) |
| 13.1. Component Analysis and Forecast by Sales Value USD Million, Y-o-Y Growth (%), and Market Share (%) |
| 13.1.1.Claims Data |
| 13.1.2.Clinical Data Setting |
| 13.1.3.Pharmacy data |
| 13.1.4.Others |
| 13.2. Indication Analysis 2021 - 2025 and Forecast 2026 - 2032 by Sales Value USD Million, Y-o-Y Growth (%), and Market Share (%) |
| 13.2.1.Cardiovascular diseases |
| 13.2.2.Oncology |
| 13.2.3.Neurology |
| 13.2.4.Urology |
| 13.2.5.Others |
| 13.3. Geography Analysis 2021 - 2025 and Forecast 2026 - 2032 by Sales Value USD Million, Y-o-Y Growth (%), and Market Share (%) |
| 13.3.1.North America |
| 13.3.2.Europe |
| 13.3.3.The Asia Pacific |
| 13.3.4.Latin America |
| 13.3.5.MEA |
| 13.4. Country Analysis 2021 - 2025 and Forecast 2026 - 2032 by Sales Value USD Million, Y-o-Y Growth (%), and Market Share (%) |
| 13.4.1.Brazil |
| 13.4.2.Mexico |
| 13.4.3.Rest of LA |
| 14. Competition Landscape |
| 14.1. Market Player Profiles (Introduction, Brand/Product Sales, Financial Analysis, Product Offerings, Key Developments, Collaborations, M & A, Strategies, and SWOT Analysis) |
| 14.2.1.IBM |
| 14.2.2.PPD Inc |
| 14.2.3.IQVIA |
| 14.2.4.Medpace |
| 14.2.5.PerkinElmer Inc. |
| 14.2.6.Icon Plc, |
| 14.2.7.Oracle |
| 14.2.8.Parexel International Corporation |
| 14.2.9.Syneos Health |
| 14.2.10.Cegedim Health Data |
| 15. Research Methodology |
| 16. Appendix and Abbreviations |
Key Market Players
Author
Muni Kumar Meravath is a seasoned Healthcare Market Research Analyst with over 6 years of experience in the healthcare domain, encompassing pharmaceuticals, medical devices, and diagnostics. A graduate in Pharmacy, he possesses a strong foundation in the intricacies of the healthcare sector. He further enhanced his expertise by pursuing an MBA in Pharmaceuticals, equipping him with valuable business acumen. His analytical skills and market insights have contributed to strategic decision-making and enhanced market positioning for various healthcare organizations. Committed to driving innovation and excellence, Muni continues to seek opportunities to improve healthcare delivery through data-driven insights.