
 Download Sample


Author
Sravani is a proficient Business Analyst with an MBA and a background in Computer Science, with seven years of expe.....
Casino Tourism Market: By Casino Type, By Game, By End User and Region Forecast 2021-2032
Report ID:285385
Published Date:Nov 2025
No of Pages:200
Format:

Casino Tourism Market size was valued at US$ 178.3 billion in 2025 and is expected to reach US$ 330.2 billion by 2032, growing at a significant CAGR of 9.2% from 2026-2032. Casino tourism is travelling to different countries to enjoy casinos while also having a holiday. Cities popular with tourists can expect to generate more revenue from land-based casinos, offline casinos grow rapidly in the market, and the casino generates hundreds of jobs and increases in the city revenue. The casino market is segmented into various casino types such as commercial, tribal, limited stakes and online gambling.
The rise in the covid cases and lockdowns increased the online casino market around the world. In most cases land-based casinos combine hotels, nightclubs, cafes, entertainment centres and shopping centres, the marketing tactics applied by online gambling and offline casinos result increase in the number of casino lovers, these are major factor that drive the casino market. Small countries are more dependent on such tourism, creating new opportunities in small countries to grow their market in the casino tourism industry.
In March 2022, Boyd Gaming Corporation announced that its wholly-owned subsidiary, Boyd Interactive Gaming Inc., has entered into a definitive agreement to acquire Pala Interactive LLC and its subsidiaries for total cash consideration of $170 million.
Study Period
2026-2032Base Year
2025CAGR
9.2%Largest Market
North-AmericaFastest Growing Market
Asia-Pacific
The increasing prevalence of gambling enthusiasts in the world is the major market driver in the Casino Tourism Market during the forecast period. Casino market is based on various platforms such is online and offline market. Offline based casino is more beneficial in revenue generation due to they are combined with hotels, restaurants, entertainment area, nightclubs which creates more revenue in the market, small countries are inviting key players to invest in casino market in the region to creates new jobs and increase in the overall revenue in the country. Hence, this are the major factor that drive the market.
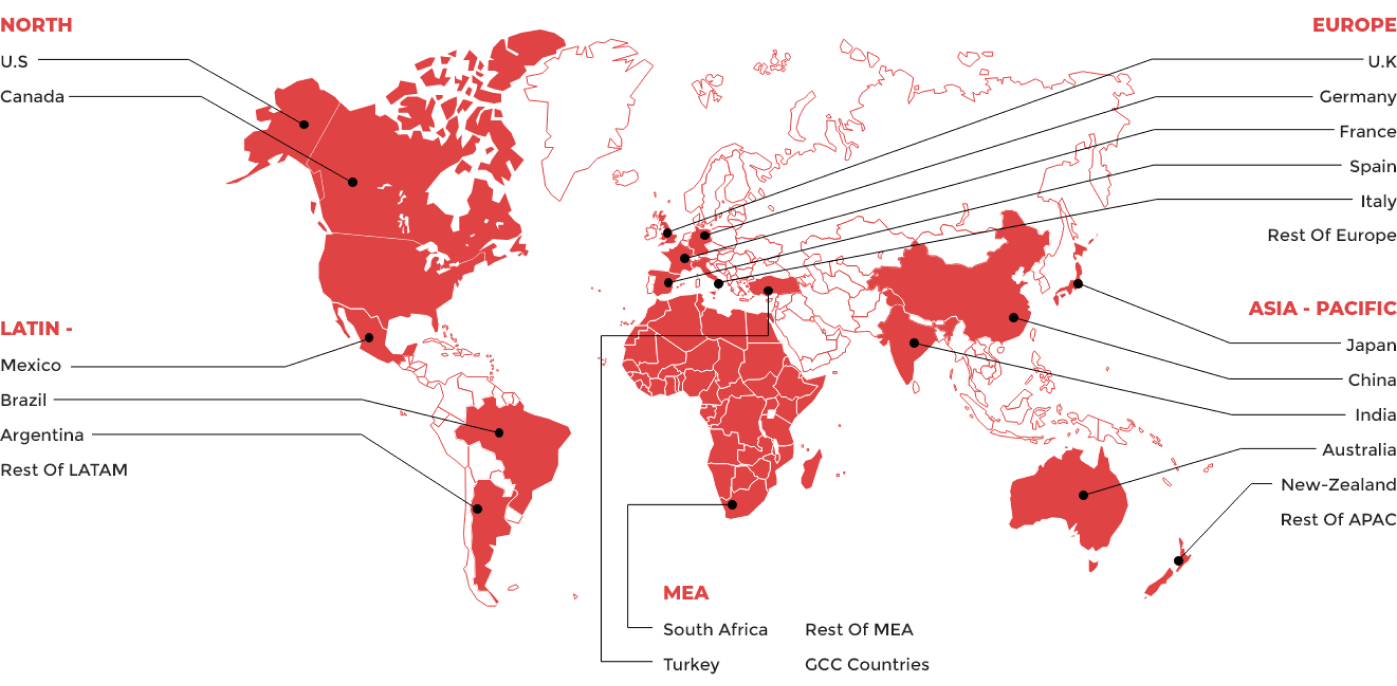
Based on regions, the market share is segmented into North America, Asia-pacific, Europe, and the Middle East, and the African region. The casino tourism market in the Asia Pacific holds a significant revenue share in 2022, and, in the following years, it is predicted to increase rapidly. It is attributed to the increasing number of inaugurating new casinos in the region and rapidly growing well-developing in the tourism market in the region results to increase in the number of demands for land-based casino market. North America is holding the major market share in the global market and is expected to dominate the market in the upcoming years due to global key players in this region. U.S., Las Vegas, Atlantic city are the major places for the market which holds the maximum revenue in the region.

Latin America

Europe

Asia Pacific

Middle East

North America
|
Report Benchmarks |
Details |
|
Report Study Period |
2026-2032 |
|
Market CAGR |
9.2% |
|
By Type |
|
|
By Game |
|
|
By End User |
|
|
By Region |
|
Download Free Sample Report
![]()
The casino tourism market size was valued at US$ 178.3 billion in 2025 and is expected to reach US$ 330.2 billion by 2032, growing at a significant CAGR of 9.2% from 2026-2032
The market key players are: 888 Holdings Plc Boyd Gaming Corporation Caesars Entertainment Corporation City of Dreams Manila Delaware Park Racetrack & Slots Dover Downs Hotel & Casino Eldorado Resort Casino Foxwoods Resort Casino Galaxy Entertainment Group Ltd Golden Nugget Atlantic City Harrington Raceway & Casino LC International Limited (Ladbrokes)- Las Vegas Sands MGM Resorts International Palms Casino Resort Penn National Gaming, Inc Philippines Amusement and Gaming Corporation (PAGCOR)- Resorts World Manila SJM Holdings Ltd Station Casinos The Strat Hotel, Casino and SkyPod William Hill PLC Wynn Resorts Limited
The market has been classified into North America, Asia Pacific, Europe, Latin America, Middle East and Africa, and the rest of MEA.
Content Updated Date: Mar 2026
| 1. Executive Summary |
| 2. Global Casino Tourism Market Introduction |
| 2.1.Global Casino Tourism Market - Taxonomy |
| 2.2.Global Casino Tourism Market - Definitions |
| 2.2.1.Type |
| 2.2.2.Game |
| 2.2.3.End User |
| 2.2.4.Geography |
| 2.2.5.Region |
| 3. Global Casino Tourism Market Dynamics |
| 3.1. Drivers |
| 3.2. Restraints |
| 3.3. Opportunities/Unmet Needs of the Market |
| 3.4. Trends |
| 3.5. Product Landscape |
| 3.6. New Product Launches |
| 3.7. Impact of COVID 19 on Market |
| 4. Global Casino Tourism Market Analysis, 2021- 2025 and Forecast 2026 - 2032 |
| 4.1. Market Analysis, 2021- 2025 and Forecast 2026 - 2032 (Sales Value USD Million) |
| 4.2. Year-Over-Year (Y-o-Y) Growth Analysis (%) |
| 4.3. Market Opportunity Analysis |
| 5. Global Casino Tourism Market By Type, 2021- 2025 and Forecast 2026 - 2032 (Sales Value USD Million) |
| 5.1. Commercial |
| 5.1.1. Market Analysis, 2021- 2025 and Forecast 2026 - 2032 (Sales Value USD Million) |
| 5.1.2. Year-Over-Year (Y-o-Y) Growth Analysis (%) and Market Share Analysis (%) |
| 5.1.3. Market Opportunity Analysis |
| 5.2. Tribal |
| 5.2.1. Market Analysis, 2021- 2025 and Forecast 2026 - 2032 (Sales Value USD Million) |
| 5.2.2. Year-Over-Year (Y-o-Y) Growth Analysis (%) and Market Share Analysis (%) |
| 5.2.3. Market Opportunity Analysis |
| 5.3. Limited Stakes |
| 5.3.1. Market Analysis, 2021- 2025 and Forecast 2026 - 2032 (Sales Value USD Million) |
| 5.3.2. Year-Over-Year (Y-o-Y) Growth Analysis (%) and Market Share Analysis (%) |
| 5.3.3. Market Opportunity Analysis |
| 5.4. Online Gaming |
| 5.4.1. Market Analysis, 2021- 2025 and Forecast 2026 - 2032 (Sales Value USD Million) |
| 5.4.2. Year-Over-Year (Y-o-Y) Growth Analysis (%) and Market Share Analysis (%) |
| 5.4.3. Market Opportunity Analysis |
| 6. Global Casino Tourism Market By Game, 2021- 2025 and Forecast 2026 - 2032 (Sales Value USD Million) |
| 6.1. 3 Card Poker |
| 6.1.1. Market Analysis, 2021- 2025 and Forecast 2026 - 2032 (Sales Value USD Million) |
| 6.1.2. Year-Over-Year (Y-o-Y) Growth Analysis (%) and Market Share Analysis (%) |
| 6.1.3. Market Opportunity Analysis |
| 6.2. American Roulette |
| 6.2.1. Market Analysis, 2021- 2025 and Forecast 2026 - 2032 (Sales Value USD Million) |
| 6.2.2. Year-Over-Year (Y-o-Y) Growth Analysis (%) and Market Share Analysis (%) |
| 6.2.3. Market Opportunity Analysis |
| 6.3. Black Jack |
| 6.3.1. Market Analysis, 2021- 2025 and Forecast 2026 - 2032 (Sales Value USD Million) |
| 6.3.2. Year-Over-Year (Y-o-Y) Growth Analysis (%) and Market Share Analysis (%) |
| 6.3.3. Market Opportunity Analysis |
| 6.4. Casino Stud Poker |
| 6.4.1. Market Analysis, 2021- 2025 and Forecast 2026 - 2032 (Sales Value USD Million) |
| 6.4.2. Year-Over-Year (Y-o-Y) Growth Analysis (%) and Market Share Analysis (%) |
| 6.4.3. Market Opportunity Analysis |
| 6.5. Others |
| 6.5.1. Market Analysis, 2021- 2025 and Forecast 2026 - 2032 (Sales Value USD Million) |
| 6.5.2. Year-Over-Year (Y-o-Y) Growth Analysis (%) and Market Share Analysis (%) |
| 6.5.3. Market Opportunity Analysis |
| 7. Global Casino Tourism Market By End User, 2021- 2025 and Forecast 2026 - 2032 (Sales Value USD Million) |
| 7.1. Casino Enthusiasts |
| 7.1.1. Market Analysis, 2021- 2025 and Forecast 2026 - 2032 (Sales Value USD Million) |
| 7.1.2. Year-Over-Year (Y-o-Y) Growth Analysis (%) and Market Share Analysis (%) |
| 7.1.3. Market Opportunity Analysis |
| 7.2. Social Exuberant |
| 7.2.1. Market Analysis, 2021- 2025 and Forecast 2026 - 2032 (Sales Value USD Million) |
| 7.2.2. Year-Over-Year (Y-o-Y) Growth Analysis (%) and Market Share Analysis (%) |
| 7.2.3. Market Opportunity Analysis |
| 7.3. Dabblers |
| 7.3.1. Market Analysis, 2021- 2025 and Forecast 2026 - 2032 (Sales Value USD Million) |
| 7.3.2. Year-Over-Year (Y-o-Y) Growth Analysis (%) and Market Share Analysis (%) |
| 7.3.3. Market Opportunity Analysis |
| 7.4. Lottery Loyalists |
| 7.4.1. Market Analysis, 2021- 2025 and Forecast 2026 - 2032 (Sales Value USD Million) |
| 7.4.2. Year-Over-Year (Y-o-Y) Growth Analysis (%) and Market Share Analysis (%) |
| 7.4.3. Market Opportunity Analysis |
| 7.5. Others |
| 7.5.1. Market Analysis, 2021- 2025 and Forecast 2026 - 2032 (Sales Value USD Million) |
| 7.5.2. Year-Over-Year (Y-o-Y) Growth Analysis (%) and Market Share Analysis (%) |
| 7.5.3. Market Opportunity Analysis |
| 8. Global Casino Tourism Market By Geography, 2021- 2025 and Forecast 2026 - 2032 (Sales Value USD Million) |
| 8.1. North America |
| 8.1.1. Market Analysis, 2021- 2025 and Forecast 2026 - 2032 (Sales Value USD Million) |
| 8.1.2. Year-Over-Year (Y-o-Y) Growth Analysis (%) and Market Share Analysis (%) |
| 8.1.3. Market Opportunity Analysis |
| 8.2. Europe |
| 8.2.1. Market Analysis, 2021- 2025 and Forecast 2026 - 2032 (Sales Value USD Million) |
| 8.2.2. Year-Over-Year (Y-o-Y) Growth Analysis (%) and Market Share Analysis (%) |
| 8.2.3. Market Opportunity Analysis |
| 8.3. Asia Pacific |
| 8.3.1. Market Analysis, 2021- 2025 and Forecast 2026 - 2032 (Sales Value USD Million) |
| 8.3.2. Year-Over-Year (Y-o-Y) Growth Analysis (%) and Market Share Analysis (%) |
| 8.3.3. Market Opportunity Analysis |
| 8.4. Latin America |
| 8.4.1. Market Analysis, 2021- 2025 and Forecast 2026 - 2032 (Sales Value USD Million) |
| 8.4.2. Year-Over-Year (Y-o-Y) Growth Analysis (%) and Market Share Analysis (%) |
| 8.4.3. Market Opportunity Analysis |
| 8.5. MEA |
| 8.5.1. Market Analysis, 2021- 2025 and Forecast 2026 - 2032 (Sales Value USD Million) |
| 8.5.2. Year-Over-Year (Y-o-Y) Growth Analysis (%) and Market Share Analysis (%) |
| 8.5.3. Market Opportunity Analysis |
| 9. Global Casino Tourism Market By Region, 2021- 2025 and Forecast 2026 - 2032 (Sales Value USD Million) |
| 9.1. North America |
| 9.1.1. Market Analysis, 2021- 2025 and Forecast 2026 - 2032 (Sales Value USD Million) |
| 9.1.2. Year-Over-Year (Y-o-Y) Growth Analysis (%) and Market Share Analysis (%) |
| 9.1.3. Market Opportunity Analysis |
| 9.2. Europe |
| 9.2.1. Market Analysis, 2021- 2025 and Forecast 2026 - 2032 (Sales Value USD Million) |
| 9.2.2. Year-Over-Year (Y-o-Y) Growth Analysis (%) and Market Share Analysis (%) |
| 9.2.3. Market Opportunity Analysis |
| 9.3. Asia Pacific (APAC) |
| 9.3.1. Market Analysis, 2021- 2025 and Forecast 2026 - 2032 (Sales Value USD Million) |
| 9.3.2. Year-Over-Year (Y-o-Y) Growth Analysis (%) and Market Share Analysis (%) |
| 9.3.3. Market Opportunity Analysis |
| 9.4. Middle East and Africa (MEA) |
| 9.4.1. Market Analysis, 2021- 2025 and Forecast 2026 - 2032 (Sales Value USD Million) |
| 9.4.2. Year-Over-Year (Y-o-Y) Growth Analysis (%) and Market Share Analysis (%) |
| 9.4.3. Market Opportunity Analysis |
| 9.5. Latin America |
| 9.5.1. Market Analysis, 2021- 2025 and Forecast 2026 - 2032 (Sales Value USD Million) |
| 9.5.2. Year-Over-Year (Y-o-Y) Growth Analysis (%) and Market Share Analysis (%) |
| 9.5.3. Market Opportunity Analysis |
| 10. North America Casino Tourism Market ,2021- 2025 and Forecast 2026 - 2032 (Sales Value USD Million) |
| 10.1. Type Analysis 2021- 2025 and Forecast 2026 - 2032 by Sales Value USD Million, Y-o-Y Growth (%), and Market Share (%) |
| 10.1.1.Commercial |
| 10.1.2.Tribal |
| 10.1.3.Limited Stakes |
| 10.1.4.Online Gaming |
| 10.2. Game Analysis 2021- 2025 and Forecast 2026 - 2032 by Sales Value USD Million, Y-o-Y Growth (%), and Market Share (%) |
| 10.2.1.3 Card Poker |
| 10.2.2.American Roulette |
| 10.2.3.Black Jack |
| 10.2.4.Casino Stud Poker |
| 10.2.5.Others |
| 10.3. End User Analysis 2021- 2025 and Forecast 2026 - 2032 by Sales Value USD Million, Y-o-Y Growth (%), and Market Share (%) |
| 10.3.1.Casino Enthusiasts |
| 10.3.2.Social Exuberant |
| 10.3.3.Dabblers |
| 10.3.4.Lottery Loyalists |
| 10.3.5.Others |
| 10.4. Geography Analysis 2021- 2025 and Forecast 2026 - 2032 by Sales Value USD Million, Y-o-Y Growth (%), and Market Share (%) |
| 10.4.1.North America |
| 10.4.2.Europe |
| 10.4.3.Asia Pacific |
| 10.4.4.Latin America |
| 10.4.5.MEA |
| 10.5. Country Analysis 2021- 2025 and Forecast 2026 - 2032 by Sales Value USD Million, Y-o-Y Growth (%), and Market Share (%) |
| 10.5.1.United States of America (USA) |
| 10.5.2.Canada |
| 11. Europe Casino Tourism Market ,2021- 2025 and Forecast 2026 - 2032 (Sales Value USD Million) |
| 11.1. Type Analysis and Forecast by Sales Value USD Million, Y-o-Y Growth (%), and Market Share (%) |
| 11.1.1.Commercial |
| 11.1.2.Tribal |
| 11.1.3.Limited Stakes |
| 11.1.4.Online Gaming |
| 11.2. Game Analysis 2021- 2025 and Forecast 2026 - 2032 by Sales Value USD Million, Y-o-Y Growth (%), and Market Share (%) |
| 11.2.1.3 Card Poker |
| 11.2.2.American Roulette |
| 11.2.3.Black Jack |
| 11.2.4.Casino Stud Poker |
| 11.2.5.Others |
| 11.3. End User Analysis 2021- 2025 and Forecast 2026 - 2032 by Sales Value USD Million, Y-o-Y Growth (%), and Market Share (%) |
| 11.3.1.Casino Enthusiasts |
| 11.3.2.Social Exuberant |
| 11.3.3.Dabblers |
| 11.3.4.Lottery Loyalists |
| 11.3.5.Others |
| 11.4. Geography Analysis 2021- 2025 and Forecast 2026 - 2032 by Sales Value USD Million, Y-o-Y Growth (%), and Market Share (%) |
| 11.4.1.North America |
| 11.4.2.Europe |
| 11.4.3.Asia Pacific |
| 11.4.4.Latin America |
| 11.4.5.MEA |
| 11.5. Country Analysis 2021- 2025 and Forecast 2026 - 2032 by Sales Value USD Million, Y-o-Y Growth (%), and Market Share (%) |
| 11.5.1.Germany |
| 11.5.2.France |
| 11.5.3.Italy |
| 11.5.4.United Kingdom (UK) |
| 11.5.5.Spain |
| 11.5.6.Rest of EU |
| 12. Asia Pacific (APAC) Casino Tourism Market ,2021- 2025 and Forecast 2026 - 2032 (Sales Value USD Million) |
| 12.1. Type Analysis and Forecast by Sales Value USD Million, Y-o-Y Growth (%), and Market Share (%) |
| 12.1.1.Commercial |
| 12.1.2.Tribal |
| 12.1.3.Limited Stakes |
| 12.1.4.Online Gaming |
| 12.2. Game Analysis 2021- 2025 and Forecast 2026 - 2032 by Sales Value USD Million, Y-o-Y Growth (%), and Market Share (%) |
| 12.2.1.3 Card Poker |
| 12.2.2.American Roulette |
| 12.2.3.Black Jack |
| 12.2.4.Casino Stud Poker |
| 12.2.5.Others |
| 12.3. End User Analysis 2021- 2025 and Forecast 2026 - 2032 by Sales Value USD Million, Y-o-Y Growth (%), and Market Share (%) |
| 12.3.1.Casino Enthusiasts |
| 12.3.2.Social Exuberant |
| 12.3.3.Dabblers |
| 12.3.4.Lottery Loyalists |
| 12.3.5.Others |
| 12.4. Geography Analysis 2021- 2025 and Forecast 2026 - 2032 by Sales Value USD Million, Y-o-Y Growth (%), and Market Share (%) |
| 12.4.1.North America |
| 12.4.2.Europe |
| 12.4.3.Asia Pacific |
| 12.4.4.Latin America |
| 12.4.5.MEA |
| 12.5. Country Analysis 2021- 2025 and Forecast 2026 - 2032 by Sales Value USD Million, Y-o-Y Growth (%), and Market Share (%) |
| 12.5.1.China |
| 12.5.2.India |
| 12.5.3.Australia and New Zealand (ANZ) |
| 12.5.4.Japan |
| 12.5.5.Rest of APAC |
| 13. Middle East and Africa (MEA) Casino Tourism Market ,2021- 2025 and Forecast 2026 - 2032 (Sales Value USD Million) |
| 13.1. Type Analysis and Forecast by Sales Value USD Million, Y-o-Y Growth (%), and Market Share (%) |
| 13.1.1.Commercial |
| 13.1.2.Tribal |
| 13.1.3.Limited Stakes |
| 13.1.4.Online Gaming |
| 13.2. Game Analysis 2021- 2025 and Forecast 2026 - 2032 by Sales Value USD Million, Y-o-Y Growth (%), and Market Share (%) |
| 13.2.1.3 Card Poker |
| 13.2.2.American Roulette |
| 13.2.3.Black Jack |
| 13.2.4.Casino Stud Poker |
| 13.2.5.Others |
| 13.3. End User Analysis 2021- 2025 and Forecast 2026 - 2032 by Sales Value USD Million, Y-o-Y Growth (%), and Market Share (%) |
| 13.3.1.Casino Enthusiasts |
| 13.3.2.Social Exuberant |
| 13.3.3.Dabblers |
| 13.3.4.Lottery Loyalists |
| 13.3.5.Others |
| 13.4. Geography Analysis 2021- 2025 and Forecast 2026 - 2032 by Sales Value USD Million, Y-o-Y Growth (%), and Market Share (%) |
| 13.4.1.North America |
| 13.4.2.Europe |
| 13.4.3.Asia Pacific |
| 13.4.4.Latin America |
| 13.4.5.MEA |
| 13.5. Country Analysis 2021- 2025 and Forecast 2026 - 2032 by Sales Value USD Million, Y-o-Y Growth (%), and Market Share (%) |
| 13.5.1.GCC Countries |
| 13.5.2.South Africa |
| 13.5.3.Rest of MEA |
| 14. Latin America Casino Tourism Market ,2021- 2025 and Forecast 2026 - 2032 (Sales Value USD Million) |
| 14.1. Type Analysis and Forecast by Sales Value USD Million, Y-o-Y Growth (%), and Market Share (%) |
| 14.1.1.Commercial |
| 14.1.2.Tribal |
| 14.1.3.Limited Stakes |
| 14.1.4.Online Gaming |
| 14.2. Game Analysis 2021- 2025 and Forecast 2026 - 2032 by Sales Value USD Million, Y-o-Y Growth (%), and Market Share (%) |
| 14.2.1.3 Card Poker |
| 14.2.2.American Roulette |
| 14.2.3.Black Jack |
| 14.2.4.Casino Stud Poker |
| 14.2.5.Others |
| 14.3. End User Analysis 2021- 2025 and Forecast 2026 - 2032 by Sales Value USD Million, Y-o-Y Growth (%), and Market Share (%) |
| 14.3.1.Casino Enthusiasts |
| 14.3.2.Social Exuberant |
| 14.3.3.Dabblers |
| 14.3.4.Lottery Loyalists |
| 14.3.5.Others |
| 14.4. Geography Analysis 2021- 2025 and Forecast 2026 - 2032 by Sales Value USD Million, Y-o-Y Growth (%), and Market Share (%) |
| 14.4.1.North America |
| 14.4.2.Europe |
| 14.4.3.Asia Pacific |
| 14.4.4.Latin America |
| 14.4.5.MEA |
| 14.5. Country Analysis 2021- 2025 and Forecast 2026 - 2032 by Sales Value USD Million, Y-o-Y Growth (%), and Market Share (%) |
| 14.5.1.Brazil |
| 14.5.2.Mexico |
| 14.5.3.Rest of LA |
| 15. Competition Landscape |
| 15.1. Market Player Profiles (Introduction, Brand/Product Sales, Financial Analysis, Product Offerings, Key Developments, Collaborations, M & A, Strategies, and SWOT Analysis) |
| 15.2.1.888 Holdings Plc |
| 15.2.2.Boyd Gaming Corporation |
| 15.2.3.Caesars Entertainment Corporation |
| 15.2.4.City of Dreams Manila |
| 15.2.5.Delaware Park Racetrack & Slots |
| 15.2.6.Dover Downs Hotel & Casino |
| 15.2.7.Eldorado Resort Casino |
| 15.2.8.Foxwoods Resort Casino |
| 15.2.9.Galaxy Entertainment Group Ltd |
| 15.2.10.Golden Nugget Atlantic City |
| 15.2.11.Harrington Raceway & Casino |
| 15.2.12.LC International Limited (Ladbrokes)- Las Vegas Sands |
| 15.2.13.MGM Resorts International |
| 15.2.14.Palms Casino Resort |
| 15.2.15.Penn National Gaming, Inc |
| 15.2.16.Philippines Amusement and Gaming Corporation (PAGCOR)- Resorts World Manila |
| 15.2.17.SJM Holdings Ltd |
| 15.2.18.Station Casinos |
| 15.2.19.The Strat Hotel, Casino and SkyPod |
| 15.2.20.William Hill PLC |
| 15.2.21.Wynn Resorts Limited |
| 16. Research Methodology |
| 17. Appendix and Abbreviations |
Key Market Players
Author
Sravani is a proficient Business Analyst with an MBA and a background in Computer Science, with seven years of experience in the field of market research. Sravani is adept at creating competitive evaluations, precise market estimations, and market projections, emphasizing the food and beverage and information and communication technology (ICT) industries. Her areas of competence are identifying important players, projecting market trends, and assessing the potential for industry growth. She applies a strong analytical approach to provide precise market estimates and thorough industry analysis, empowering organizations to make data-driven decisions. Sravani's estimating and forecasting abilities are essential for businesses to take advantage of new opportunities and effectively manage dynamic market environments.